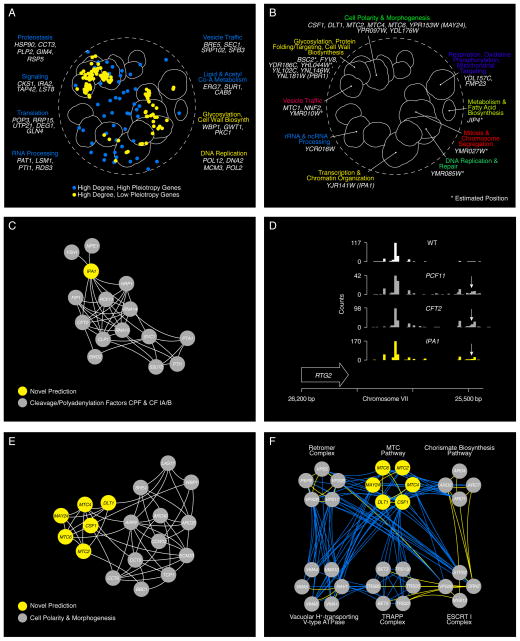
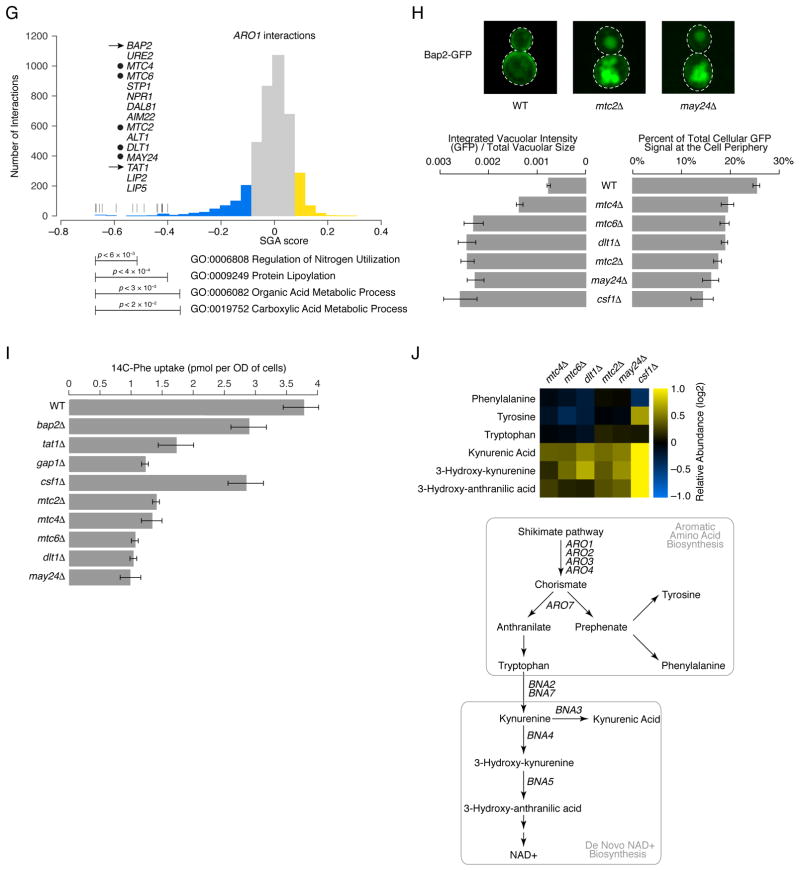
Figure 4. Using network connectivity to explore gene function.
(A) Highly connected hub genes identified either as pleiotropic (blue nodes), or functionally specific (yellow nodes), are highlighted on a schematic representation of the global similarity network. Examples of high (blue text) and low (yellow text) pleiotropy genes, grouped based on their general function, are shown. (B) Poorly characterized genes that localize within, or in the vicinity of, a specific biological process-enriched cluster on the global similarity network. For genes whose genetic interaction profile similarity to other genes does not exceed a PCC > 0.2 and would otherwise not appear on the global similarity network, an estimated position based on the most similar genes appearing in the network is indicated (*). (C) A genetic interaction profile similarity subnetwork for the uncharacterized essential gene, IPA1 (yellow node), extracted from the Transcription & Chromatin Organization enriched biological process cluster. (D) Polyadenylation profiles for a representative gene, RTG2, generated from genome-wide sequencing of mRNA purified from a wild-type strain (WT) and strains carrying TS mutations of PCF11, CFT2 or IPA1. The horizontal arrow indicates the orientation of the RTG2 open reading frame, the vertical arrows indicate the mutant, increased aberrant, 3′ mRNA cleavage and polyadenylation. (E) A genetic interaction profile similarity sub-network for MTC2, MTC4, MTC6, CSF1, DLT1 and MAY24 genes (yellow nodes) extracted from the network region in the vicinity of the Cell Polarity & Morphogenesis biological process cluster. (F) The MTC pathway genetic interaction network. Nodes are grouped according to genetic interaction profile similarity and edges represent negative (blue) and positive (yellow) interactions (genetic interaction score, |ε| > 0.08, P < 0.05). (G) Distribution of ARO1 negative (blue) and positive (yellow) genetic interactions (|ε| > 0.08, P < 0.05; gene pairs that failed to meet threshold for interactions are colored grey). Functions enriched among genes that displayed an extreme negative interaction with ARO1 are indicated and a subset of these genes is shown. Closed circles indicate members of the MTC pathway and arrows indicate amino acid permease encoding genes. (H) Representative cell images illustrating Bap2-GFP localization in wild type, mtc2Δ and may24Δ deletion mutant strains (Top panel). Vacuolar intensity (total GFP signal in the vacuole/vacuolar area) and percent of total cellular GFP present at the cell periphery (cell periphery GFP/total cellular GFP signal) were quantified for wild type cells and MTC pathway mutants (Bottom panel). Error bars indicate standard deviation from three replicate experiments. (I) Cellular uptake of 14C-labeled phenylalanine in wild type and deletion mutant strains. Error bars indicate standard deviation from three replicate experiments. (J) Metabolite levels for the indicated mutants were analyzed by full scan LC-MS (Top panel). The levels of selected metabolites are presented as log2 ratios relative to wild type cells. Schematic diagram illustrating aromatic amino acid and de novo NAD+ biosynthesis pathways (bottom panel).


