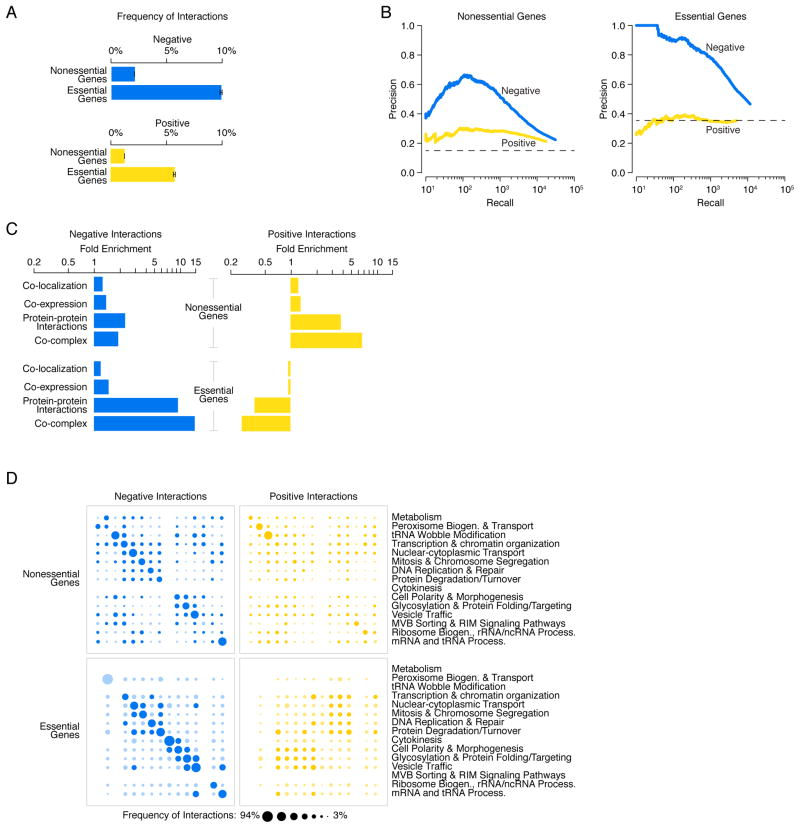
Figure 5. Negative and positive genetic interactions connecting nonessential and essential genes.
(A) The network density of negative (blue) and positive (yellow) genetic interactions, expressed as a fraction of all tested gene pairs, associated with nonessential and essential genes, at a defined threshold (genetic interaction score, |ε| >0.08, P < 0.05). Error bars indicate the standard deviation across multiple samplings of the alleles for essential genes, where each gene is represented by a single, randomly selected allele in each sampling. (B) Plots of precision versus recall (number of true positives (TP)) for negative (blue) and positive (yellow) interactions for nonessential and essential genes, as determined by our genetic interaction score (|ε| >0.08, P < 0.05). True positive interactions were defined as those involving gene pairs co-annotated to a gold standard set of GO terms. The precision and recall values were calculated as described (8). (C) Fold enrichment for negative (blue) and positive (yellow) genetic interactions among co-localized, co-expressed, or physically interacting, gene pairs were calculated for either nonessential or essential gene pairs. (D) Network density of genetic interactions within and across biological processes. The fraction of screened nonessential and essential gene pairs exhibiting negative or positive interactions, as determined by our genetic interaction score (|ε| >0.08, P < 0.05), was measured for the 17 gene sets enriched for specific biological processes, as defined in Fig. 1F. Node size reflects the fraction of interacting gene pairs observed for a given pair of biological processes. Dark blue and dark yellow nodes indicate that the frequency of interaction is significantly above random expectation. Light blue and light yellow nodes represent a frequency of interaction that is not significantly higher than random expectation. Nodes on the diagonal represent the frequency of interactions among genes belonging to the same biological process. Nodes off the diagonal represent the frequency of interactions between different biological processes.

