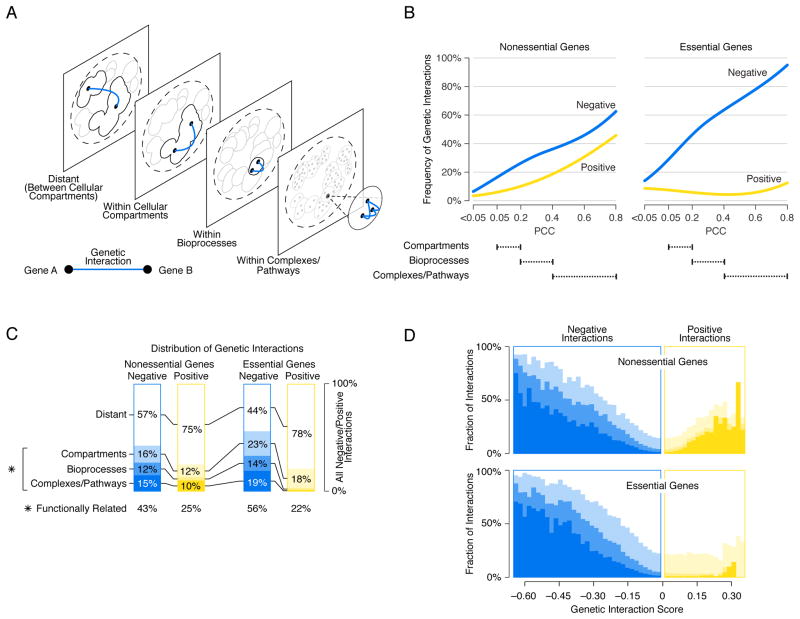
Figure 6. Mapping negative and positive interactions across the genetic network based functional hierarchy.
(A) Schematic representation of the genetic network-based functional hierarchy illustrating interactions between genes within the same complex, biological process, or cellular compartment, as well as distant interactions that span different cellular compartments. (B) The network density of genetic interactions between genes in the same cluster, at a given level of profile similarity (PCC) in the genetic network hierarchy for negative (blue) or positive (yellow) genetic interactions (genetic interaction score, |ε| > 0.08, P < 0.05). Dashed lines indicate the PCC range within which clusters in the genetic network hierarchy were enriched for cell compartments, bioprocesses, and protein complexes. (C) The functional distribution of all negative (blue) and all positive (yellow) interactions (|ε| > 0.08, P < 0.05) among genes in the genetic network hierarchy. The percentage of all interactions connecting nonessential gene pairs and essential gene pairs in the same clusters corresponding to a cell compartment, bioprocess or complex/pathway is shown. The combined fraction of functionally related interactions (i.e. interactions connecting genes in the same compartment, bioprocess, complex or pathway) is also indicated (*). (D) The percentage of negative (blue) and positive (yellow) interactions within a specified genetic interaction score (ε) range that connects genes belonging to the same cluster at the indicated level of the genetic network-based hierarchy. Different shades of blue and yellow correspond to levels of functional relatedness shown in (C). The white area corresponds to the fraction of interactions that connect genes in different cellular compartments (i.e. Distant).

