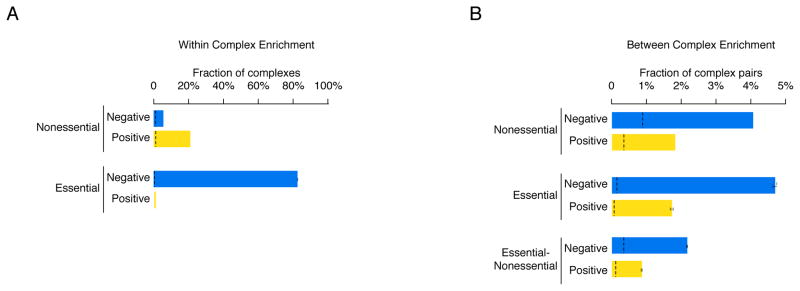
Figure 7. Genetic interactions within and between protein complexes.
(A) The percentage of nonessential and essential complexes whose members were enriched for genetic interactions with each other and biased (i.e. coherent) for either mostly negative (blue) or mostly positive (yellow) interactions. (B) The percentage of nonessential-nonessential, essential-essential or essential-nonessential complex-complex pairs found to be enriched for genetic interactions and biased (i.e. coherent) for either mostly negative (blue) or mostly positive (yellow) interactions. Black dashed lines indicate the background rate of coherent genetic interaction enrichment within individual complexes or between pairs of protein complexes. Error bars indicate the standard deviation across multiple samplings of the alleles for essential genes, where each gene is represented by a single, randomly selected allele in each sampling.

