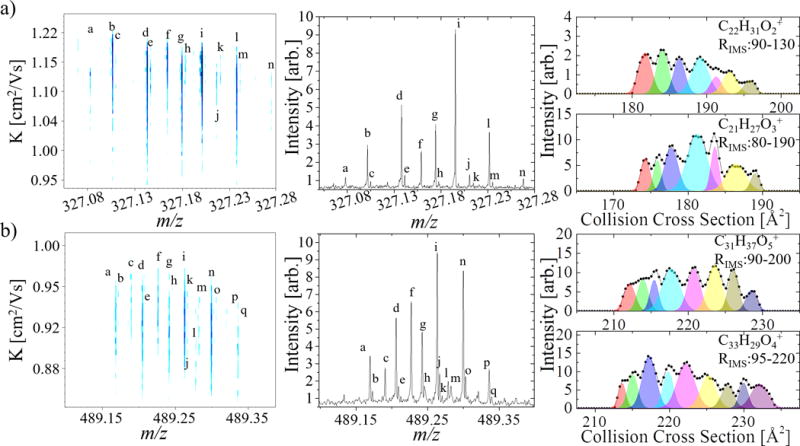
Figure 2.

Typical 2D TIMS-FT-ICR MS contour plot and MS projections for m/z a) 327 and b) 489. IMS projections for specific chemical formulas (connected scatterplot) with the unsupervised fitting by SAME package of minimum number of mobility features is shown. Note that the SAME package relies on the experimental profile of the distribution, which is able to show multiple features due to the high resolving power of the TIMS analyzer. Formula assignments are provided in table 1.
