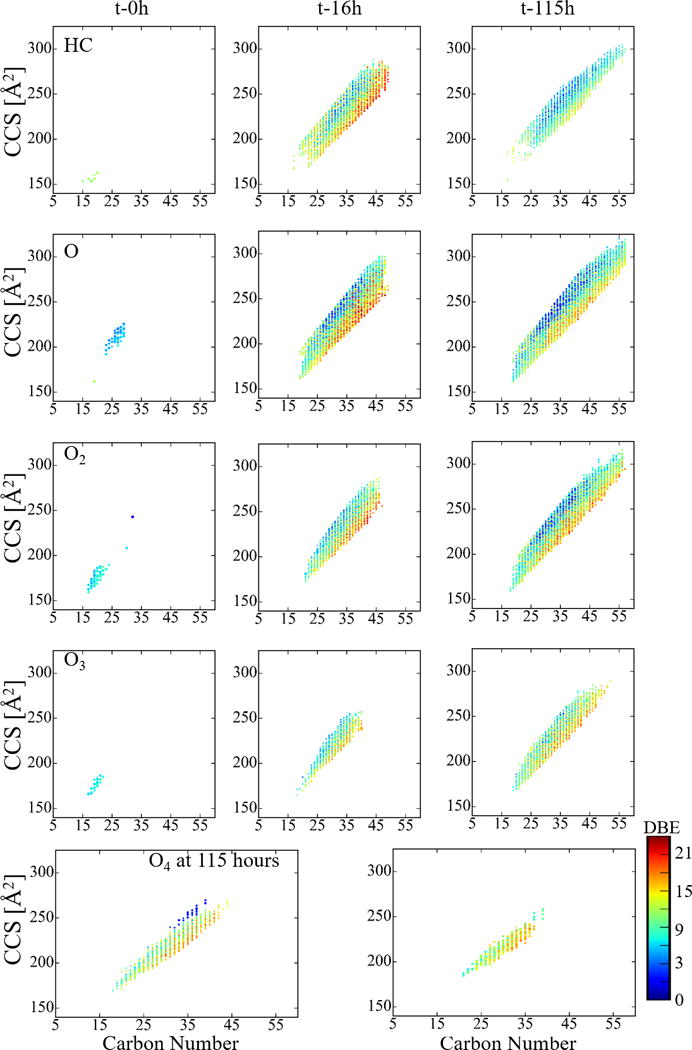
Figure 3.

Typical size dependence (CCS) with carbon number for the O0-4 chemical classes observed in the WAF samples as a function to exposure to light (t-0, 16 and 115h). The color scale corresponds to the number of rings and double bond equivalents (DBE) of a molecule. Note the large increase in assignments between t-0h and t-16h, as well as increases in oxygen content between t-16h and t-115h.
