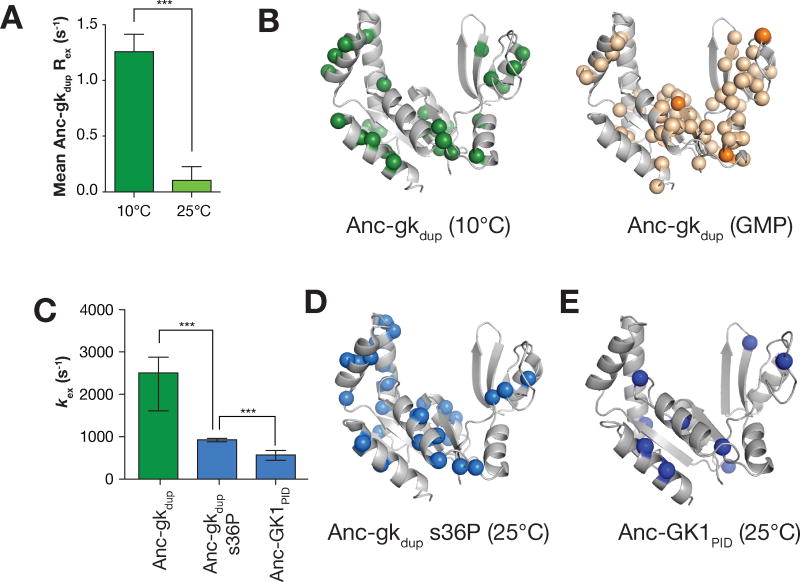
Figure 3.
Quenching of GK open-close interconversion dynamics during GKPID evolution. A. Rex in Anc-gkdup increases dramatically at 10°C compared to 25°C. The average Rex is shown for all assigned residues in Anc-gkdup at 25°C and 10°C. Error bars represent standard error and asterisks represent p < 0.001 (t-test). A residue by residue comparison of Rex at both temperatures is shown in Supporting Information. B. Rex in Anc-gkdup at 10°C monitors a global process. Anc-gkdup residues with significant Rex at 10°C (spheres) are shown on the structure of the yeast GK enzyme (PDB 1EX6). For comparison, Anc-gkdup chemical shift perturbations induced by GMP are also shown. Residues shifting 0.15–0.59 ppm are colored light orange, while those with a greater shift magnitude are dark orange. C. The evolution of PID function was accompanied by slowed GK dynamics. The mean exchange rate constants (kex) for Anc-gkdup, Anc-gkdup s36P, and Anc-GK1PID (all from measurements at 25°C) are shown. Error bars represent standard error and asterisks represent p < 0.001 (t-test). D, E. Anc-gkdup s36P (D) and Anc-GK1PID (E) residues used to determine kex (i.e. those with significant Rex).

