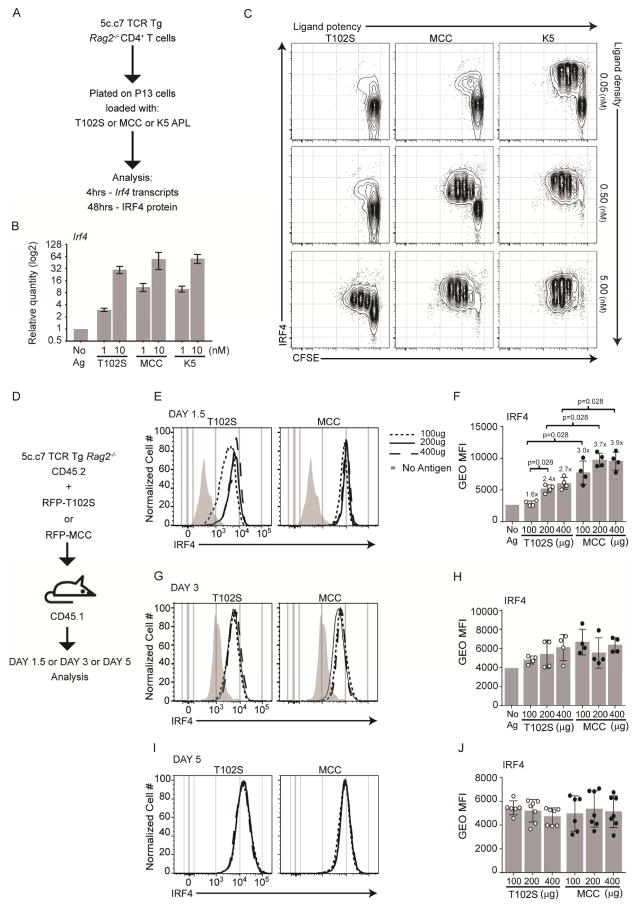
Figure 2.
Initial Irf4 amounts scale proportionally with increased TCR signal strength. (A) Stimulation scheme of CFSE labeled 5c.c7 TCR Tg CD4+ T cells (CD45.2+, Rag2−/−), P13 antigen presenting fibroblasts (I-Ek+B7-1+ICAM+), and MCC APL. (B) 4hrs after stimulation, Irf4 transcripts were measured by RT-qPCR and normalized to Oct1; average and SEM of four biological replicates from two experiments performed. (C) 2 days after stimulation contour plots of CFSE and Irf4 expression on CD4+ cells are shown. Representative result of 3 experiments performed. (D) Immunization scheme of 5c.c7 TCR Tg CD4+ T cells (CD45.2+, Rag2−/−), congenic CD45.1+ B10.A hosts, and RFP-MCC or RFP-T102S antigens. 1.5 days (E–F) 3 days (G–H) or five days (I–J) after immunization, donor cells (CD45.1−B220−MHCII−CD45.2+CD4+) were analyzed. Histograms (E, G, I) and gMFI, mean±SD (F, H, J) of Irf4. Experiments in E–J are from 8 mice in 2 experiments performed; contour plots are concatenated files from all mice of a given group in a given experiment. Numbers above the bars in (F) represent gMFI fold change over that of the no antigen control. See also Figure S2.

