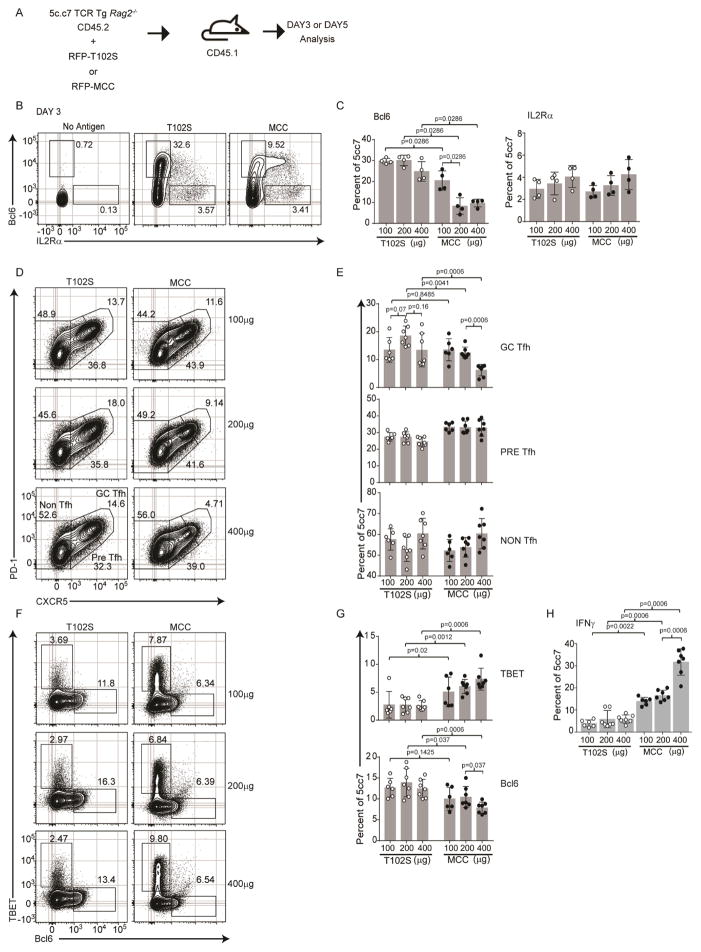
Figure 3.
TCR regulated Irf4 concentrations control alternate Th cell fate decisions. (A) Immunization scheme of 5c.c7 TCR Tg CD4+ T cells (CD45.2+, Rag2−/−), congenic CD45.1+ B10.A hosts, and RFP-MCC or RFP-T102S antigens. 3 days (B) and 5 days (D–H) after immunization, donor cells (CD45.1−B220−MHCII−CD45.2+CD4+) were analyzed. Contour plots (B) and frequencies, mean±SD (C) of the indicated Bcl6 and IL2rα populations; contour plots (D) and frequencies, mean±SD (E) of the indicated PD-1 and CXCR5 populations; contour plots (F) and frequencies, mean±SD (G) of the indicated Tbet and Bcl6 populations; frequencies, mean±SD (H) of IFNγ secretion. Experiments in B are from 8 mice, in C–H are from 7 mice, all from two experiments performed; contour plots are concatenated files from all mice of a given group in a given experiment. Experiment in B used 200μg antigen. See also Figure S3.

