Figure 4.
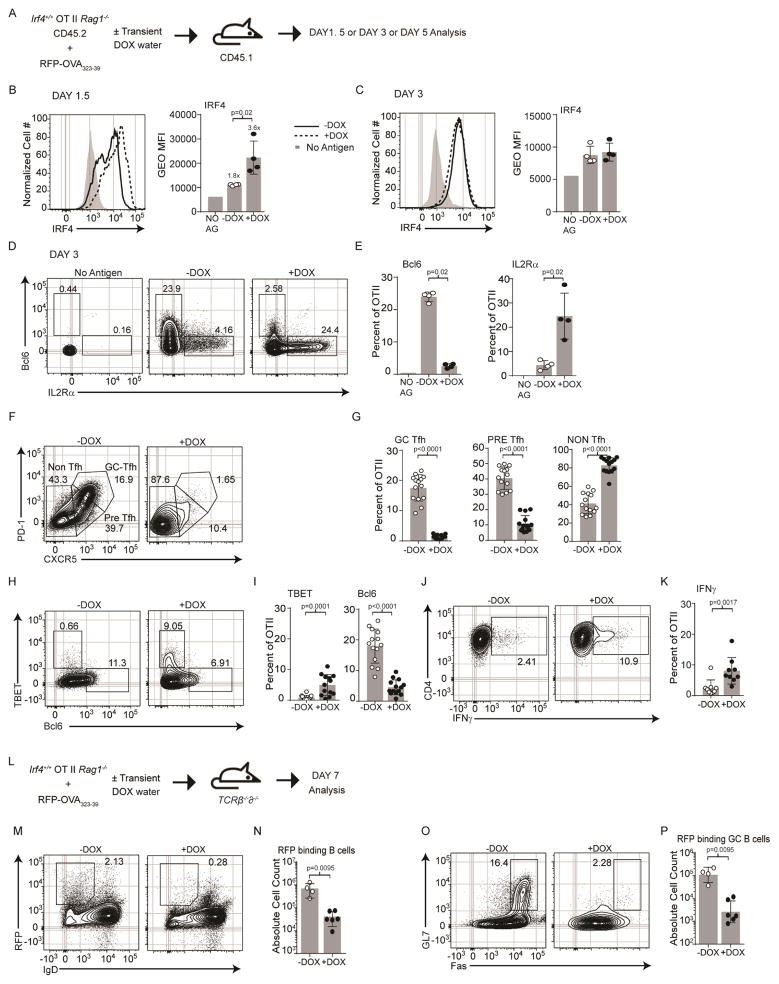
Cell concentrations of Irf4 direct Tfh versus Teff cell fates. (A) Immunization scheme of Irf4-inducible (Irf4+/+) OT-II TCR Tg CD4+ T cells (CD45.2+, Rag1−/−), congenic CD45.1+ hosts, RFP-OVA antigen, and ± DOX treatment during the first two days of immunization only. 1.5 days (B), 3 days (C–E), or 5 days (F–K) after immunization, donor cells (CD45.1−B220−MHCII−CD45.2+CD4+) were analyzed. Irf4 histograms and gMFI, mean±SD (B–C); contour plots (D) and frequencies, mean±SD (E) of the indicated Bcl6 and IL2rα populations; contour plots (F) and frequencies, mean±SD s (G) of the indicated PD-1 and CXCR5 populations; contour plots (H) and frequencies, mean±SD (I) of the indicated Tbet and Bcl6 populations; contour plots (J) and frequencies, mean±SD (K) of the indicated IFNγ populations. (L) Immunization scheme as in (A) except using Tcrβ−/−δ−/− hosts. 7 days after immunization, contour plots (M) and frequencies, mean±SD (N) of B cells (B220+) binding RFP; contour plots (O) and frequencies, mean±SD (P) of RFP-binding GC B cells (Fas+GL7+). Experiments in B–E are from 4 mice of a single experiment, in F–K are from 14 mice in 4 experiments performed, in M–P are from 6 mice in 2 experiments performed; contour plots are concatenated files from all mice of a given group in a given experiment. Numbers above the bars in (B) represent gMFI fold change over the no antigen control. See also Figure S4.

