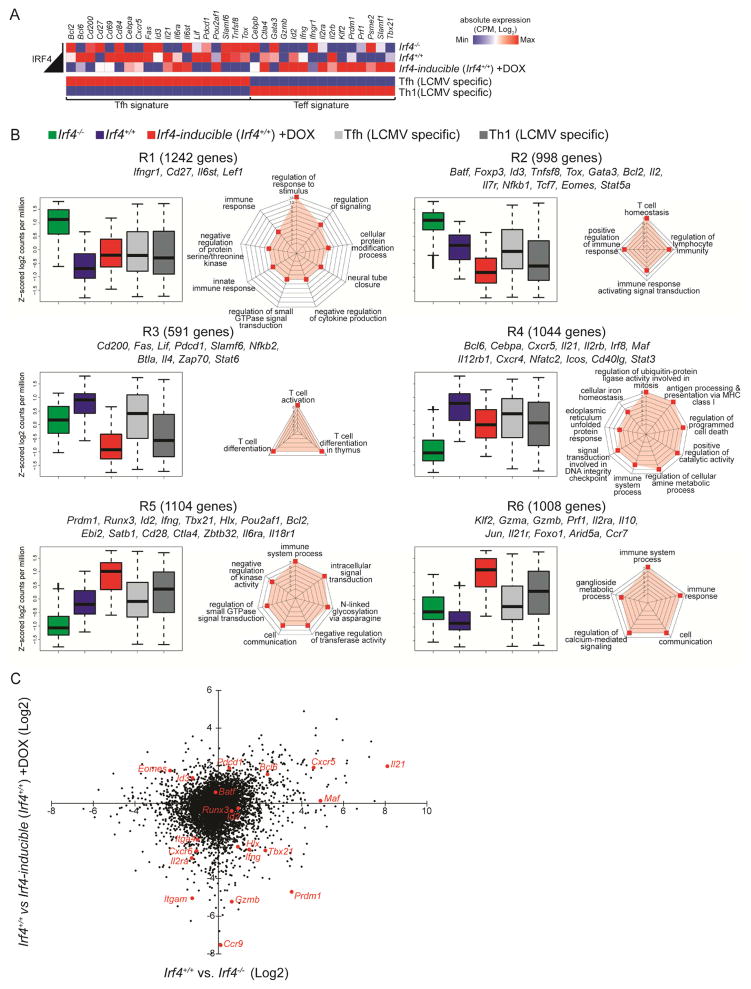
Figure 5.
Low and high Irf4 expression levels control distinct Th cell gene programs. Irf4−/−, Irf4+/+, or Irf4-inducible (Irf4+/+) OT-II TCR Tg CD4+ T cells (CD45.2+, Rag1−/−) were adoptively transferred into congenic CD45.1+ hosts and immunized with RFP-OVA. Three days after immunization, donor cells (CD45.1−B220−MHCII−CD45.2+CD4+) were sorted and processed for RNA-seq. Mice harboring Irf4-inducible OT-II cells were administered water containing DOX for the first two days of immunization only. Three to five biological replicates, comprised of pooled cells from multiple mice, were processed for each group. (A) RNA-seq absolute expression in counts per million (CPM) of indicated transcripts and indicated groups including LCMV-specific Tfh and Th1 cells (GEO: GSM1645004-7). (B) Six patterns of differentially expressed RNA transcripts, R1-6, are shown as box plots (median ±%75th for the box and ±%25th for the whiskers) plotted as a function of averaged Z-scored values. Genes from the Irf4 analysis was used to filter those from Tfh and Th1 (as in A). The number of gene members of each cluster as well as representative genes of the cluster are shown. To the right of the box plots, spider plots display the highest scoring gene ontology terms, organized by p-value. (C) Dot plot of differential gene expression; select Tfh and Teff genes are called out in red. See also Figure S5 and Tables S1–2.

