Figure 7.
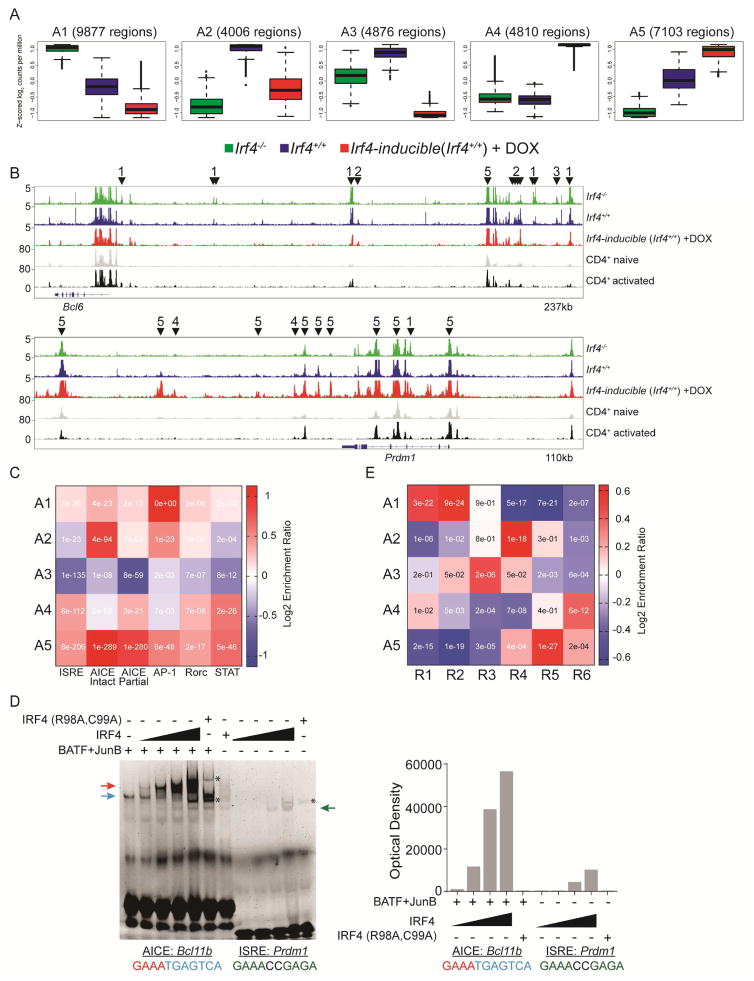
Irf4 targets distinct DNA motifs to control Tfh and Teff gene programs. ATAC-seq libraries were generated from the same cells in Figure 5. (A) Five patterns of differentially ChARs, A1-5, are shown as box plots (median ±%75th for the box and ±%25th for the whiskers) plotted as a function of averaged Z-scored values. The number of regions within each cluster are shown. (B) Peak tracks at the Bcl6 and Prdm1 loci from the indicated groups; CD4+ naïve and activated are from (GEO: GSE37074). ChARs from a given cluster are highlighted with a downward facing arrowhead and the parental cluster. Peaks with no arrows are not differentially accessible. (C) Heat map depicting the enrichment ratio (Log2) of given Irf4 DNA binding motifs (x-axis) in clusters A1-5 (y-axis); inset text represents the enrichment p-value (Fisher’s Exact Test). (D) Binding saturation curves of Irf4 to the AICE or ISRE motifs. Binding reactions using the AICE probe derived from Bcl11b were carried out in the presence of a constant amount of BATF and JunB containing nuclear extracts. Irf4 containing nuclear extract was increased in 2-fold increments as indicated. The ISRE probe from Prdm1 was used in binding reactions with Irf4 containing nuclear extracts as for the AICE reaction. Nuclear extracts containing a DNA-binding deficient Irf4 (R98A, C99A) were used at the highest concentration of the wild type Irf4 saturation curve as a specificity control. Arrows indicate complexes; AP-1 (blue), Irf4/AP-1 (red), and Irf4 homodimer (green); asterisk indicates non-specific binding. Densitometry analysis is shown to the right of the gel. Representative of two experiments performed. E) Heat map depicting the enrichment ratio of gene members from RNA clusters R1-6 (x-axis) in ChARs A1-5 (y-axis); inset text represents the enrichment p-value (Fisher’s Exact Test). See also Figure S7 and Tables S1–7.

