
Figure 2. Expression of EGFRvIII in Cultured GBM Neurospheres (GBMsp).
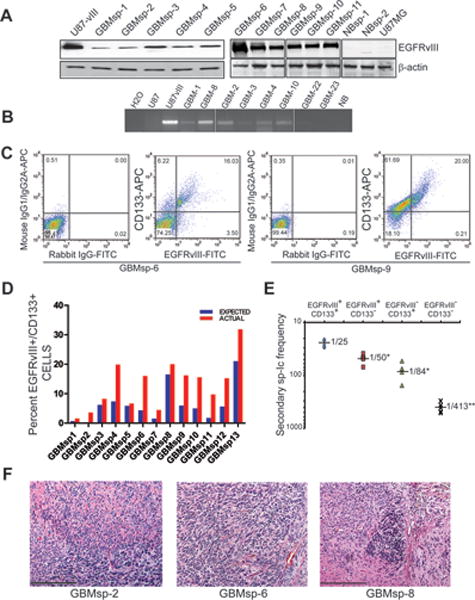
Tumor spheres derived from dissociated primary human GBMs were cultured in stem cell media prior to analysis. A) Immunoblot analysis of lysates from cultured GBMsp (GBMsp), normal brain spheres (NBsp) from epileptic patients, and control U87MG and U87-vIII for EGFRvIII expression and β- actin. B) RT-PCR for EGFRvIII transcription from total RNA of cultured GBMsp and normal brain (NB) and U87MG and U87-vIII samples as controls. C) Flow cytometry analysis of co-expression of EGFRvIII (x axis) and CD133 (y axis) in dissociated GBMsp. The left panels of each sample show isotype control background (mouse IgG1/IgG2B for CD133 and rabbit IgG for EGFRvIII), and the right panels show signal for anti-CD133 and anti-EGFRvIII. D) Comparison of actual versus expected CD133/EGFRvIII co-expression in all cultured GBMsp samples tested. E) Secondary sphere initiating (sp-Ic) frequency of 6 tumor sphere lines from cells sorted into 4 populations ( ) EGFRvIII+/CD133+, ( ) EGFRvIII+/CD133−, ( ) EGFRvIII−/CD133+, (×) EGFRvIII−/CD133−. *= statistical significance (p<0.01), **= statistical significance (p<0.001). F) Cultured GBMsp cells were intracranially injected into NOD-SCID mice and assayed for tumor formation. Shown are micrographs of H & E staining of three sphere lines (Scale bar = 500 μm).