
FIGURE 3.
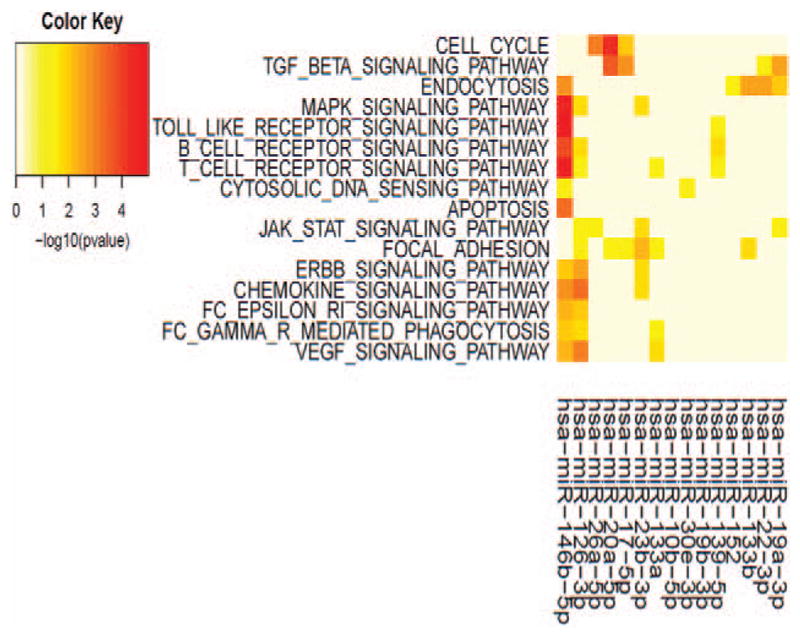
Pathway analysis of miRNAs differentially expressed in cotinine-positive samples. Pathway analysis (see Materials and Methods) of differentially expressed miR-NAs in cotinine-positive samples based on ranking according to P values was performed in R (R package miRNApath1 for pathway analysis). Serum cotinine levels were used to group the samples into tobacco users (n =11) compared with non-tobacco users (n =19) as described in the Materials and Methods section. The color map P values indicate the strength of the association between the miRNA and the relevant pathway. Pathways targeted by fewer than two miRNAs and miRNAs that targeted fewer than two pathways were omitted for clarity.