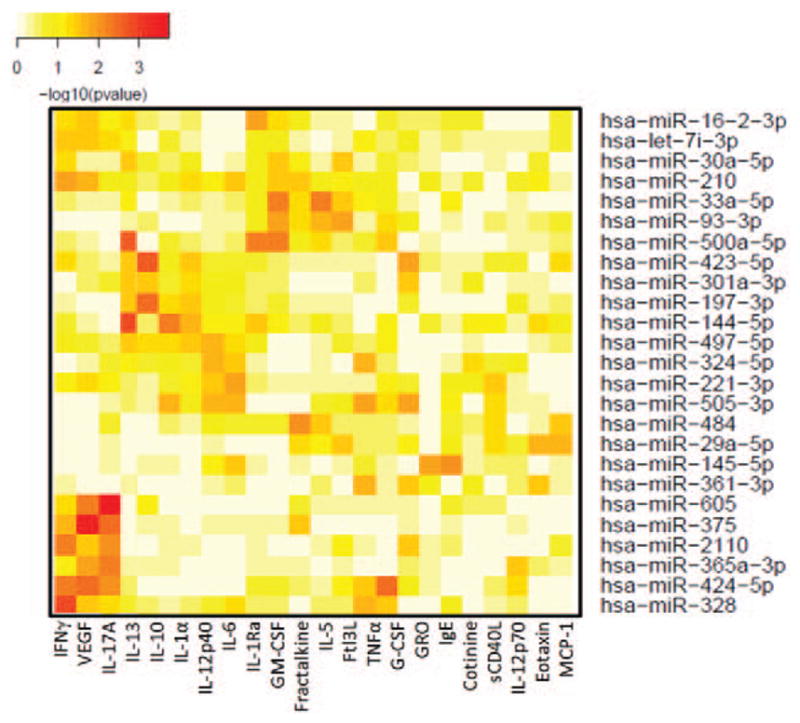
FIGURE 5.

Cluster analysis of correlations between miRNA and cytokines. The miRNAs (y-axis) with significant P values for >3 cytokines (x-axis) are plotted. The complete set of correlations is provided as supplemental table 1 (http://links.lww.com/JOM/A269). The color map from yellow to red indicate lower to high –log10 (P values).
