Fig. 4.
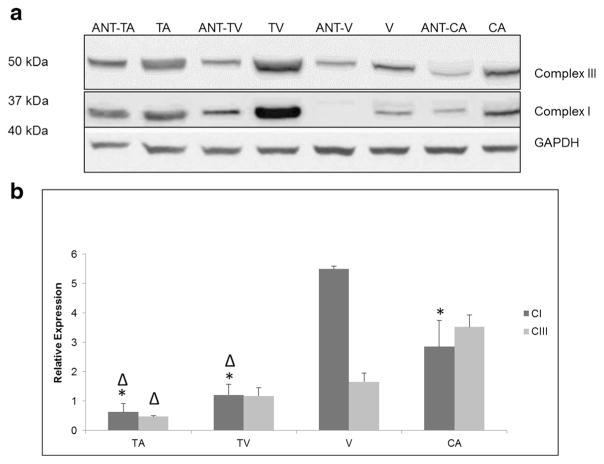
Expression of mitochondrial complexes I and III in colorectal tumors and paired adjacent normal tissues. a Lysates were analyzed by Western blot to examine the levels of complex proteins in tubular adenoma (TA), tubulovillous tissue (TV), villous tissue (V), and adenocarcinoma tissue (CA) compared to paired adjacent normal tissues (ANT). Complex proteins were normalized against GAPDH. b Protein bands were quantified using relative optical density calculated using NIH ImageJ software. Expression profiles of complexes I (CI) and III (CIII) were normalized against their adjacent normal tissues. Significant differences between tested groups with a p value (<0.05) is denoted with an asterisk when compared to V and Δ when compared to CA. Data are presented as mean ± s.e.m.

