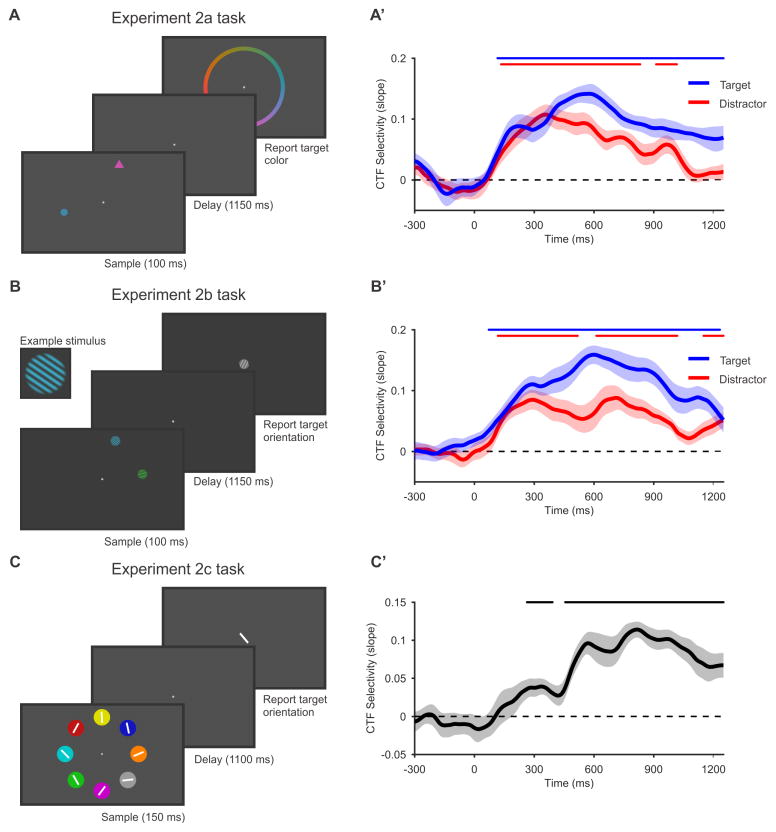
Figure 3. Spatial alpha-band CTFs reveal persistent spatial representations that are related to the storage of non-spatial content in working memory.
(A–C) Tasks in experiments 2a–c. (A) In Experiment 2a, observers performed a selective storage task. The sample display contained two colored shapes (a circle and a triangle). One shape served as a target, and the other as a distractor. We instructed observers to remember and report the color of the target, and to ignore the distractor. The target shape did not change throughout the session, and was counterbalanced across observers. (B) In Experiment 2b, observers performed an orientation version of the selective storage task used in Experiment 2a. In this experiment, observers saw two oriented gratings (one green and one blue), and were instructed to remember and report the orientation of the grating in the target color (counterbalanced across observers). (C) In Experiment 2c, observers saw a balanced array of stimuli and were instructed to remember and report the orientation of the line in the target-colored circle. The target color did not change throughout the experiment, and was varied across observers.
(A′–C′). Spatial selectivity of alpha-band CTFs in experiments 2a–c. In Experiments 2a (A′) and Experiments 2b (B′), we examined the spatial selectivity (measured as CTF slope) for the target position (blue) and distractor position (red). In both experiments, spatial selectivity was higher for the target-related CTF than for the distractor-related CTF. This modulation of CTF selectivity by storage goals reveals a component of spatial selectivity that is related to the volitional storage of non-spatial features in working memory. In Experiment 2c (C′), we saw a robust alpha-band CTF that tracked the target position throughout the retention interval. In this experiment, we completely eliminated spatially specific stimulus-driven activity by presenting the target stimulus in a balanced visual display. Thus, the alpha-band CTF in this experiment must be related to the storage of the target orientation in WM. The markers at the top of each plot mark the periods of reliable spatial selectivity. All shaded error bars reflect ±1 SEM.
See also Figures S2 and S4, and Table S1.

