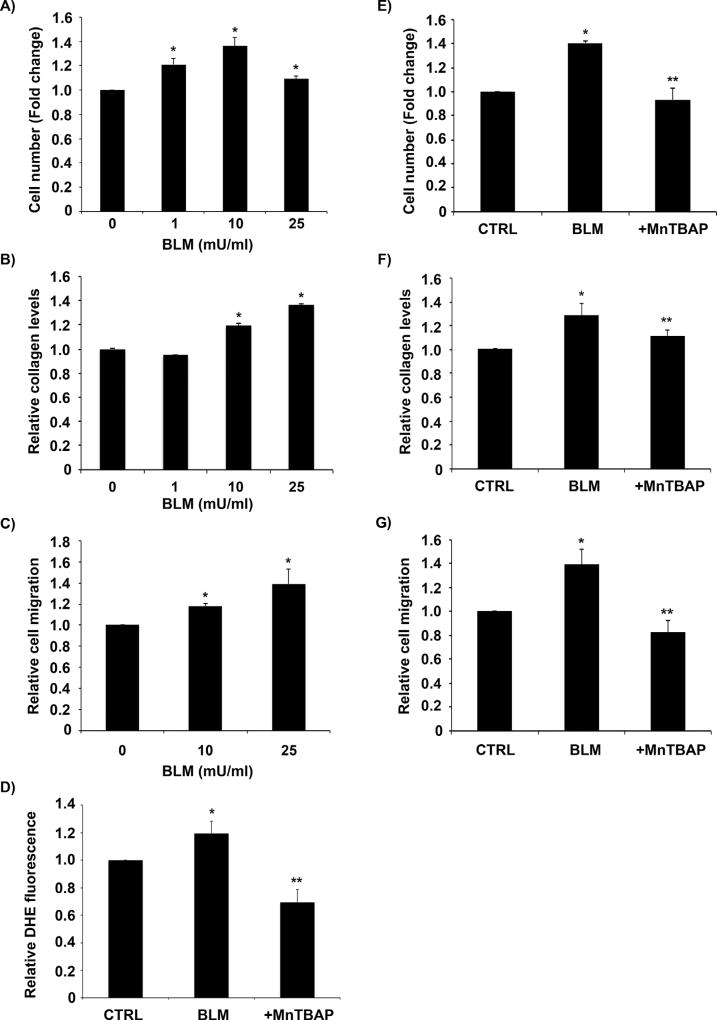
Fig. 1. MnTBAP inhibits bleomycin-induced fibrogenic effects.
(A) CRL-1490 cells were treated with the indicated concentrations of bleomycin for 24 h after which they were trypsinized and counted using a hemocytometer. (B) Supernatant from CRL-1490 cells treated with varying concentrations of bleomycin (0–25 mU/ml) for 24 h were collected and analyzed for soluble collagen content by Sircol® assay. (C) Subconfluent CRL-1490 cells were treated with bleomycin (10 mU/ml or 25 mU/ml) for 48 h and relative cell migration was analyzed by in vitro scratch assay. (D) CRL-1490 cells were pre-treated for 1 h with MnTBAP (100 µM) followed by bleomycin (10 mU/ml) treatment and analyzed for ROS production by measuring DHE fluorescence intensity. Plots show relative fluorescence intensities over non-treated control at a peak response time of 3 h after treatment. (E) CRL-1490 cells were pre-treated for 1 h with MnTBAP (100 µM), and then treated with bleomycin (10 mU/ml) for 24 h. The cells were trypsinized and counted using a hemocytometer. (F) CRL-1490 cells were pre-treated for 1 h with MnTBAP (100 µM), and then treated with bleomycin (10 mU/ml) for 24 h. Cell supernatants were collected and analyzed for soluble collagen content by Sircol® assay. (G) Subconfluent CRL-1490 cells were pre-treated for 1 h with MnTBAP (100 µM), treated with bleomycin (25 mU/ml) for 48 h and relative cell migration was analyzed by in vitro scratch assay. Plots are mean ± S.E.M (n = 4). *P < 0.05 versus non-treated control. **P < 0.05 versus bleomycin treatment.

