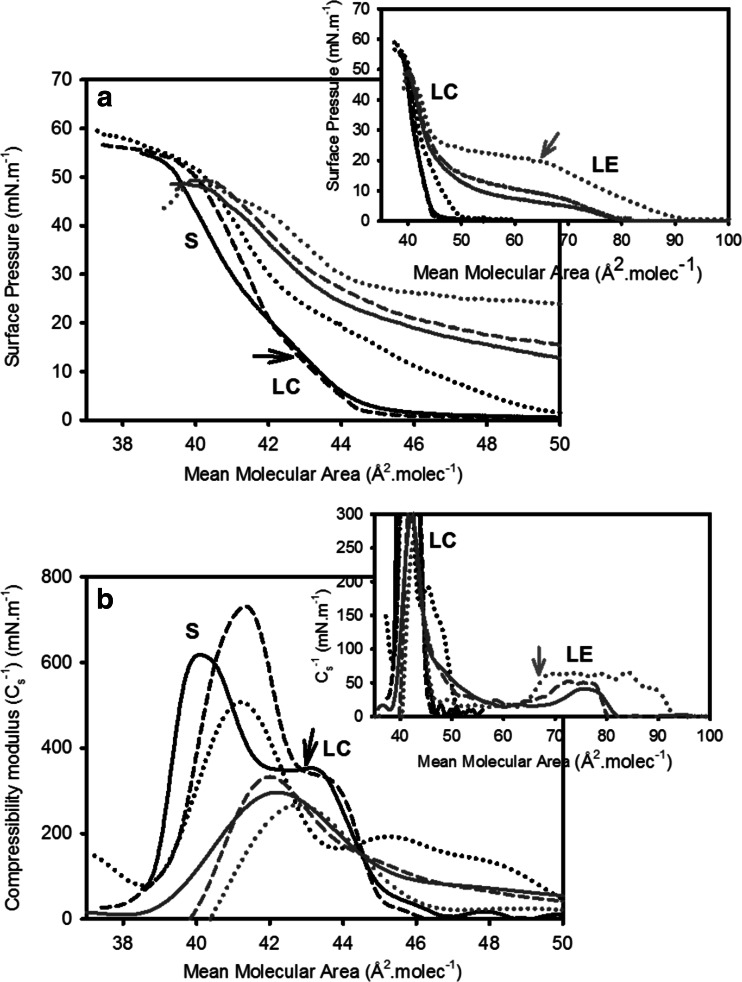
Fig. 1.
First compression Isotherms of 16:0 Cer monolayers at different temperatures. Surface pressure (a) - and compressibility modulus (Cs −1) (b): mean molecular area curves are shown for 16:0 Cer at 23 °C (black full line), 34 °C (black dashed line), 39 °C (black dotted line), 45 °C (gray full line), 49 °C (gray dashed line) and 62 °C (gray dotted line). Insets show an extended mean molecular area axis. LE, LC and S stand for liquid-expanded, liquid-condensed and solid phase state, respectively. Black arrows show the LC–S phase transition. Gray arrows show the beginning of the LE–LC phase transition. The curves show a single representative experiment from a set of triplicates. Reprinted from Fanani and Maggio (2010), with permission from Elsevier

