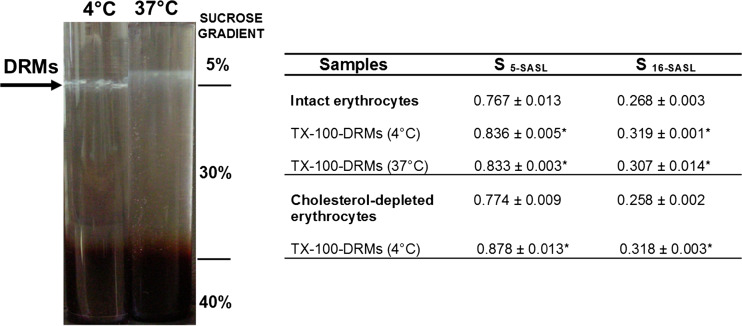
Fig. 5.
Representative image of DRMs obtained in the sucrose density gradients after centrifugation of intact erythrocytes previously treated with TX-100 at 4 °C and 37 °C. The table shows the order parameter (S) values calculated from EPR spectra of the spin labels 5 and 16-SASL in intact and depleted-cholesterol erythrocytes and their respective DRMs. Statistical differences for S values between all DRMs and their corresponding controls (intact cells) were observed: *P < 0.001, unpaired Students’s t test; n = 8–10 for intact erythrocytes, n = 4–5 for cholesterol-depleted erythrocytes, n = 3–5 for DRMs. S values were extracted from Domingues et al. (2010) in which details are discussed

