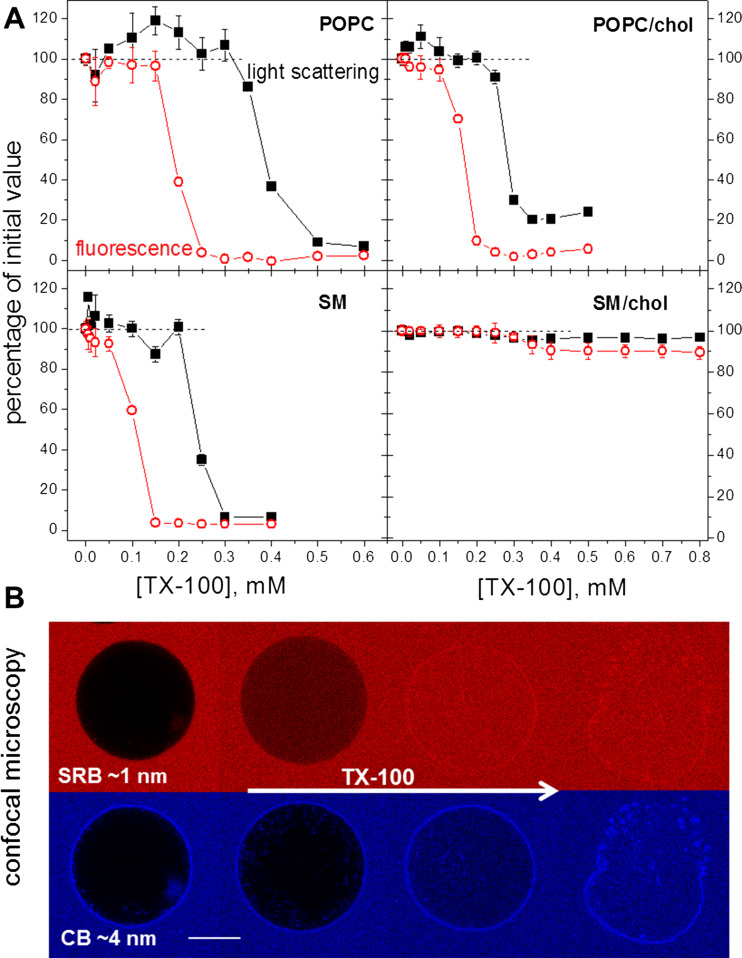
Fig. 7.
a Profiles of membrane permeabilization and of the solubilization extent. The graphs show percentages of 90° light scattering (λ = 500 nm) (closed black symbols) and of PTS fluorescence intensity (λex = 355 nm; λem = 405 nm) (open red symbols) of LUVs as a function of the TX-100 concentration, in respect to LUVs without TX-100. LUVs were prepared in 10 mM HEPES pH 7.4 with 1 mM PTS and diluted 100× in 10 mM HEPES pH 7.4 with 2 mM MV and the given concentration of TX-100, to yield a final 0.1 mM lipid concentration. Each point represents the values obtained ~5 min after dilution of the LUV dispersion. b Confocal microscopy image sequences obtained from one POPC GUV in two channels (red for SRB: λex = 552 nm, λem = 560–630 nm and blue for CB: λex = 405 nm, λem = 410–480 nm) as TX-100 diffused through the chamber and reached the vesicle. Scale bar 20 μm. Figure adapted from Mattei et al. (2017)

