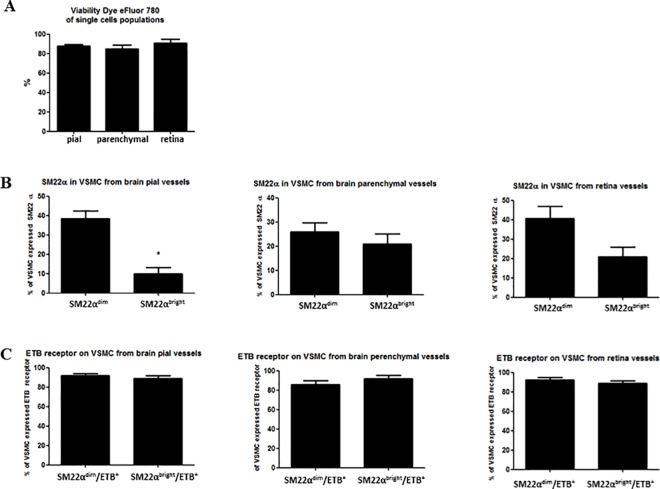
Fig 3. The bar graphs show summary data of flow-cytometry analysis.
(A) The percentage of viable single cells after tissue isolation of pial, parenchymal and retina vessels (N = 6, N = 4 and N = 4, respectively). (B) The percentage of VSMC expressed SM22α from pial (N = 5, *p˂0.05), parenchymal (N = 4) and retina vessels (N = 3). (C) The percentage of VSMC (SM22α-positive) expressed ETB receptor from pial, parenchymal and retina vessels (N = 5, N = 4 and N = 3 respectively).

