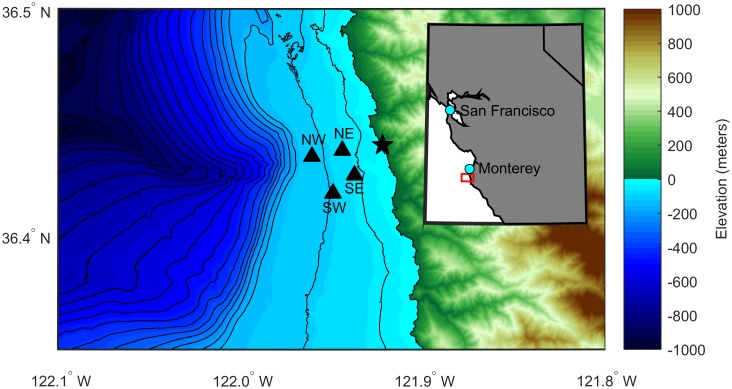
Fig 1. Deployment locations of acoustic recording packages.
The study area is off central California as denoted by the red box in the inset map. Acoustic recording packages are indicated with black triangles and labeled according to their relative positions. The location of the NOAA Southwest Fisheries Science Center surveys are indicated with a black star. Colors indicate land elevation and seafloor depth with respect to sea level. Black contour lines show seafloor depth in 50 m increments. Bathymetry data from the NOAA National Centers for Environmental Information’s Southern California Coastal Relief Model with 1 arc-second resolution.

