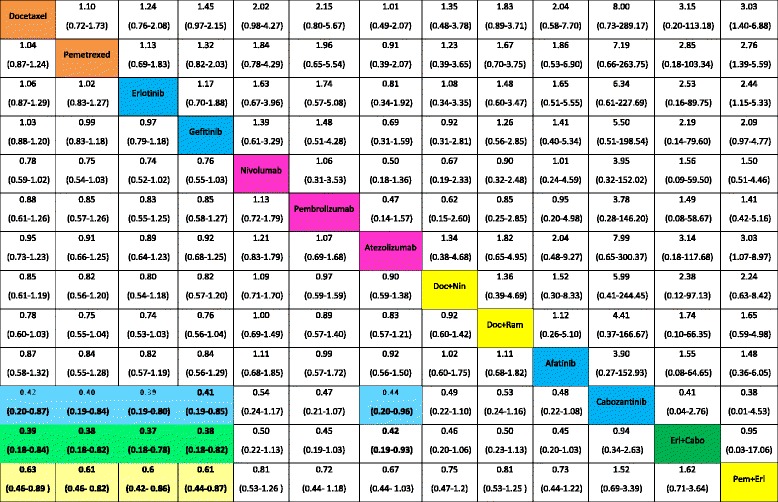
Table 3.
Hazard ratios (HRs) for progression-free survival (PFS, lower triangle) and odds ratios for objective response (ObR, upper triangle) with their 95% CrIs derived from network meta-analysis of 13 second-line treatments for NSCLC with wild-type or unknown status for EGFR

Treatment categories
Pembro pembrolizumab; Ate atezolizumab; Doc docetaxel; Erl erlotinib; Nin nintedanib; Ram ramucirumab; Cabo cabozantinib
The direction of the reported relative effects in each cell is defined as treatment on the right vs. treatment on the left. Values < 1 favor the intervention on the right. Values in parenthesis are 95% credible intervals (95% CrIs). Colored cells correspond to statistically significant relative effects for the respective treatment categories. For instance, cabozantinib was more effective than docetaxel in terms of PFS (HR 0.42 (95% CrI 0.20-0.87)
