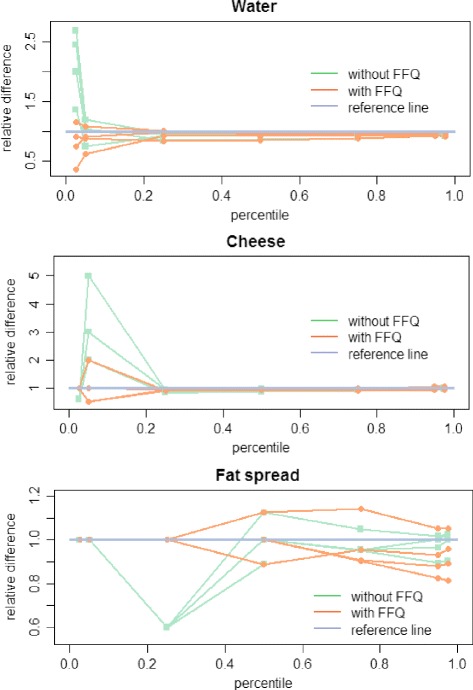
Fig. 5.

Relative fit of the SPADE 2-part model without/with inclusion of FFQ information on never-consumers, Belgian National Food Consumption Survey 2004. Legend: Relative differences of the usual intakes in function of the percentiles for four replicate simulations. Without FFQ presents the ratio of the usual intake amount (g/day) obtained with the SPADE 2-part model without FFQ information on never-consumers, divided by the simulated “true” usual intake amount (g/day). With FFQ the same, but with the inclusion of the FFQ information on never-consumers. The reference line represents a ratio of one, a ratio equal to one indicates that the model fitted by the SPADE 2-part model gives exactly the same result as the simulated “true” usual intake distribution
