
Fig 1.
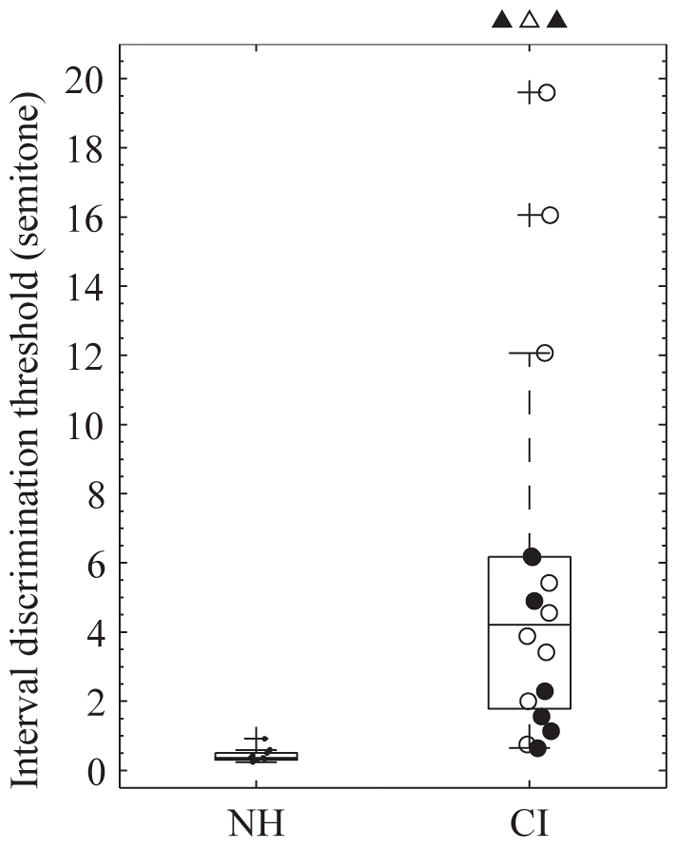
Box plot of the averaged pitch interval discrimination thresholds across two melodies for the 10 normal-hearing participants (NH) and the 19 cochlear implant participants (CI). Each box depicts the lower quartile, median, and upper quartile. The whiskers show the range of the rest of the data. The thresholds for the CI participants who had worn a hearing aid for more than one year are plotted with filled symbols, and those for the CI participants who had little (≤ 1 year) or no hearing aid experiences are plotted with open symbols. The three triangles plotted at the top represent the three CI participants who could not perform the interval discrimination test even at a ΔF0 of 2 octaves.