
Fig 2.
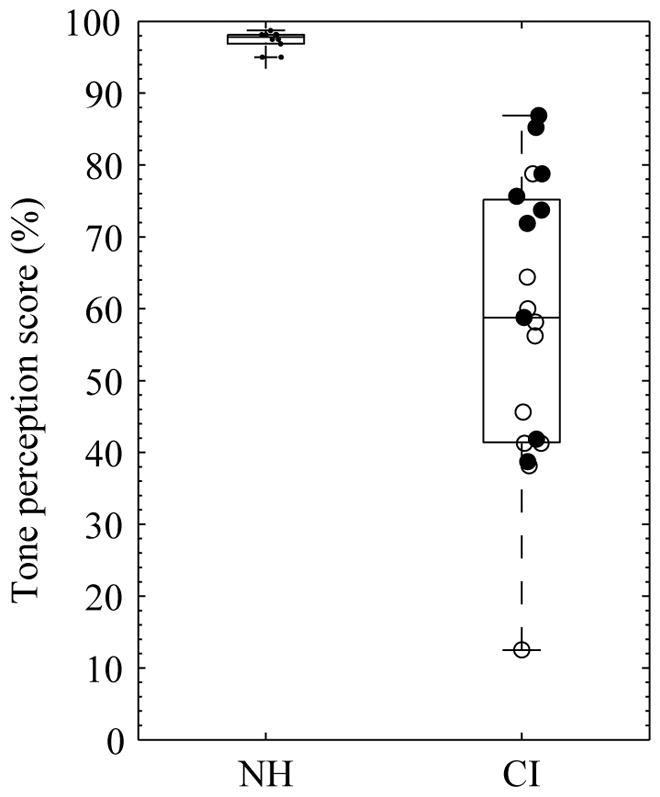
Box plot of the Mandarin-Chinese tone perception scores. Percent correct scores of the 10 NH and 19 CI participants are plotted. Each box depicts the lower quartile, median, and upper quartile. The whiskers show the range of the rest of the data. Thresholds from the CI participants who had worn a hearing aid for more than one year are plotted in filled circles, and thresholds from those who had little (≤ 1 year) or no hearing aid experience are in open circles.