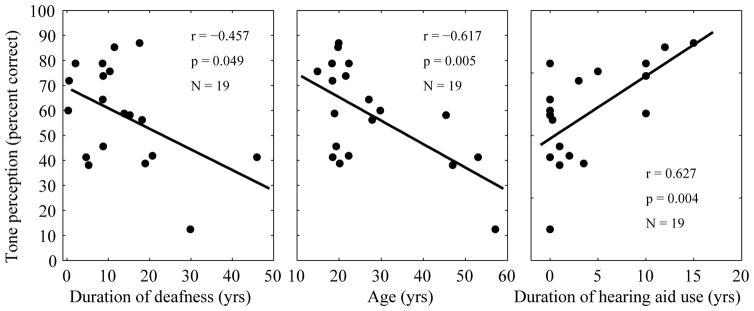
Fig 4.
Correlation between tone perception scores and demographic variables of the CI participants. Pearson’s linear correlation between tone perception scores and duration of deafness (left), age (middle), and duration of hearing aid use (right). Each symbol represents one subject with a CI. The solid line represents the linear fit of the data in each panel.

