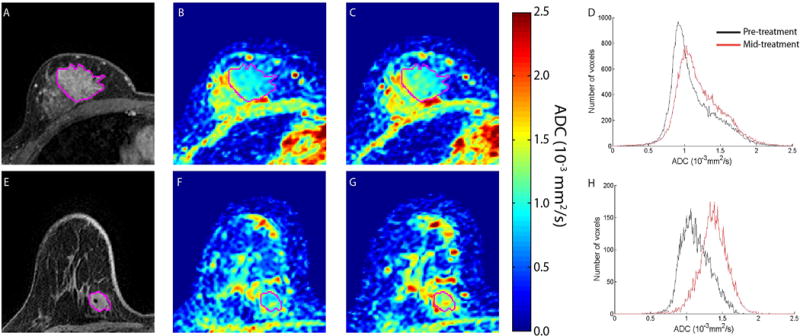
Figure 4.

Therapeutic-induced changes in breast tumor ADC values. MRI images are depicted for non-responding (top row) and responding (bottom row) patients treated for breast cancer. (A) and (E) T1-weighted gadolinium enhanced, (B) and (F): pre-treatment ADC maps, (C) and (G): ADC maps at 8–11 days after treatment initiation, D) and (H): Histograms of ADC values in the tumor pre-treatment and post-treatment initiation. Tumor is delineated from surrounding healthy tissue in the individual images by the purple line. (Reprinted from Galban CJ, Ma B, Malyarenko D, et al. Multi-site clinical evaluation of DW-MRI as a treatment response metric for breast cancer patients undergoing neoadjuvant chemotherapy. PLoS One 2015;10(3):e0122151; with permission.)
