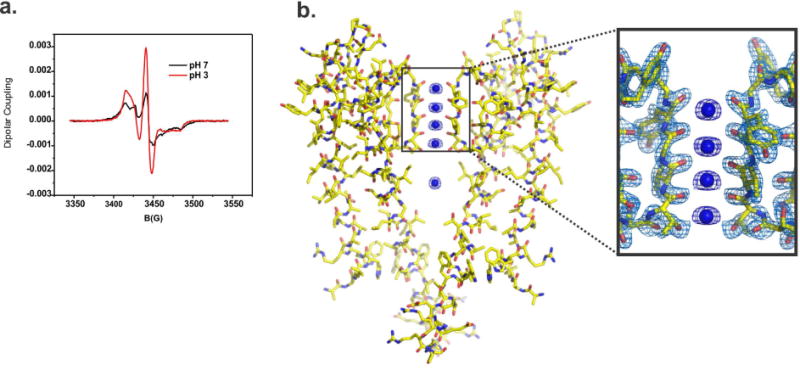
Figure 5. Spectroscopic assessment of gating and structural evaluation by X-ray Crystallography of KcsA extracted by Triton X-100.

A. pH dependent structural changes at the activation gate monitored by CW-EPR spectroscopy of KcsA extracted by Triton X-100. Black spectrum shows typical dipolar coupling of spin labels at position 116 when the channel is closed at pH 7 (black line) or open at pH 4. B. On the left, X-ray crystal structure of KcsA extracted by Triton X-100 @ 2.3 Å resolution, the high-quality of the electron density map allowed us to build a complete KcsA model. On the right, a view of the structural model of KcsA’s selectivity filter, the 2Fo-Fc electron density map (contoured @ 2σ for the protein and 3σ for the K+) is surrounding amino acids that form KcsA’s selectivity filter (only two subunits are depicted).
