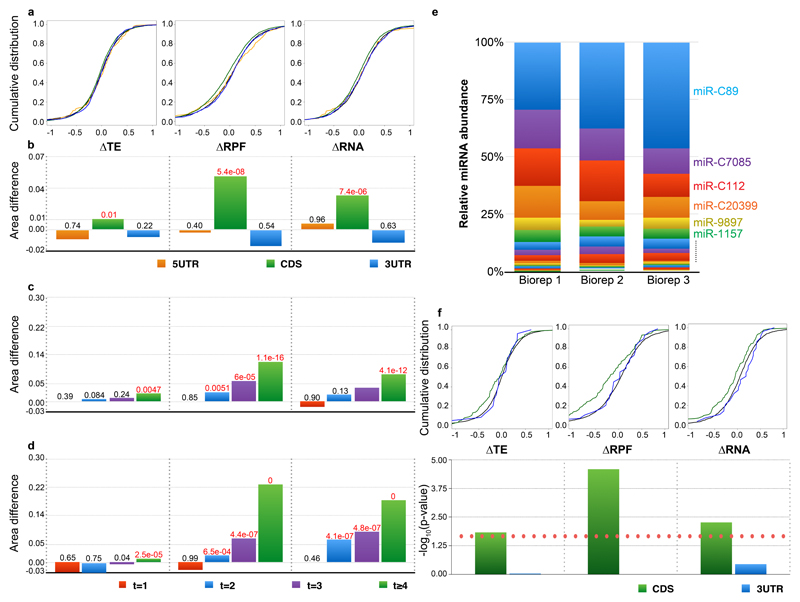
Figure 3. miRNA downregulates gene expression primarily through mRNA destabilization by CDS targeting.
(A) Cumulative distributions of ΔTE (left), ΔRPF (middle) and ΔRA (right) log2 fold changes in dcl3-1 relative to Cdcl3. Colors correspond to genes containing predicted 8mer miRNA target sites exclusively in the 5’UTR (orange), CDS (green), 3’UTR (blue), or no targets (black).
(B) Bar graph of differences between area under cumulative distribution of mRNA containing target sites and non-target containing mRNAs (5'UTR, CDS and 3'UTR in orange, green and blue, respectively). Significance (K.S. test) of the differences are indicated above each bar; p-values less than or equal to 0.01 are highlighted in red.
(C-D) Bar graph of differences between area under cumulative distribution of mRNA containing 1 (red), 2 (blue), 3 (purple) or 4 or more (green) CDS-exclusive target sites and non-target containing mRNAs. Significance (K.S. test) of the differences are indicated above each bar; p-values less than or equal to 0.01 are highlighted in red.
(E) Normalised miRNA abundances of Cdcl3 (in three biological replicates).
(F) Cumulative distributions (top) and significance (bottom; the red dotted line indicates p-value of 0.01) of ΔTE (left), ΔRPF (middle) and ΔRA (right) log2 fold changes for mRNAs containing miR-C89 target sites exclusively within the CDS (green) or 3’UTR (blue) (sample sizes 141 and 25, respectively). 5’UTR-exclusive targets were omitted due to low sample size.

