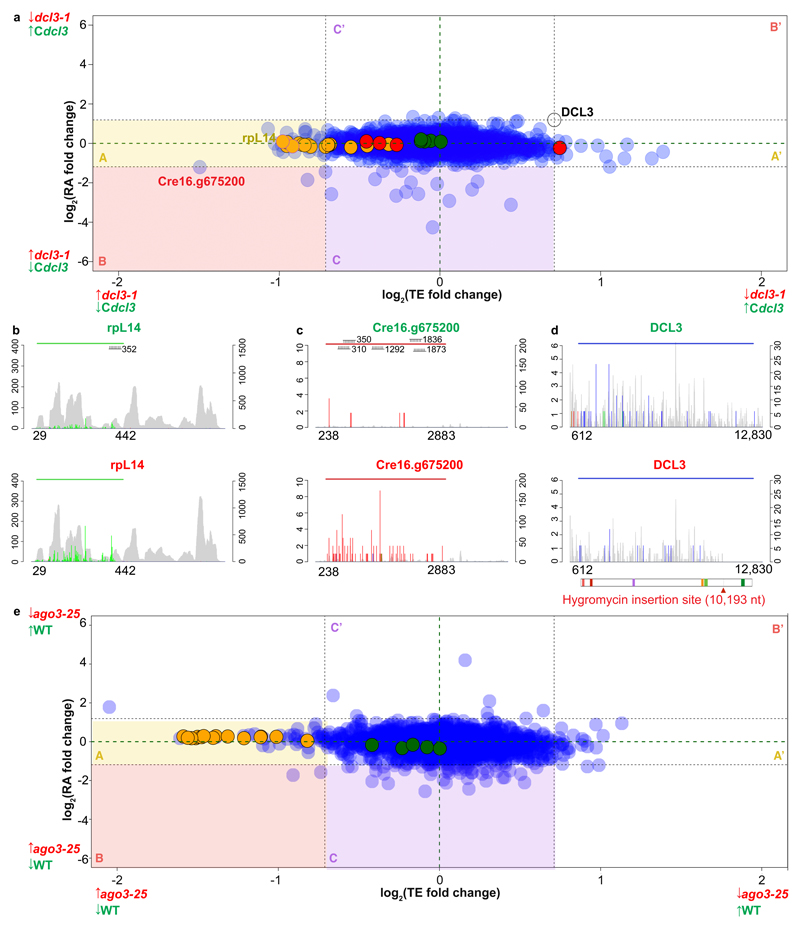
Figure 4. Effects of miRNAs on TE and RA.
(A) Correspondence between TE and RA fold-changes between dcl3-1 and Cdcl3 for nuclear-encoded genes containing miRNA target sites exclusively within the CDS (except DCL3, which was included as a marker). 80S, chloroplast and mitochondria ribosomal proteins are in orange, green and red, respectively.
(B-C) Histograms of 5' end positions of normalized RPF (colored, left-axis) and RNA-Seq (grey, right-axis) 27-nt reads mapped to genes with high differential TE: ribosomal proteins rpL14 and Cre16.g675200. The top (green title) and bottom (red title) graphs are derived from either Cdcl3 or dcl3-1, respectively. The colored horizontal line indicates the riboSeqR de novo-defined ORF; positions of potential miRNA target sites are annotated.
(D) Histogram of 5’ end positions of normalized RPF (colored, left-axis) and RNA-Seq (grey, right-axis) 27-nt reads mapped to DCL3 transcripts. The blue horizontal line indicates the CDS (612-12,830 nt). The schematic below the plot shows the domain organization of DCL3 which contains two DEAD/DEAH box helicase domains (light and dark red boxes), a helicase domain (purple box), a proline-rich domain (orange box) and two ribonuclease III domains a and b (light and dark green boxes, respectively). The thick grey line and the corresponding red arrow below indicate the hygromycin insertion site (nt 10,193).
(E) Correspondence between TE and RA fold-changes between ago3-25 and wild type CC-1883 for nuclear-encoded genes containing miRNA target sites exclusively within the CDS. Nuclear-encoded 80S and chloroplast ribosomal proteins are in orange and green, respectively. Mitochondrial ribosomal proteins are not shown due to low level of detection in the dataset.

