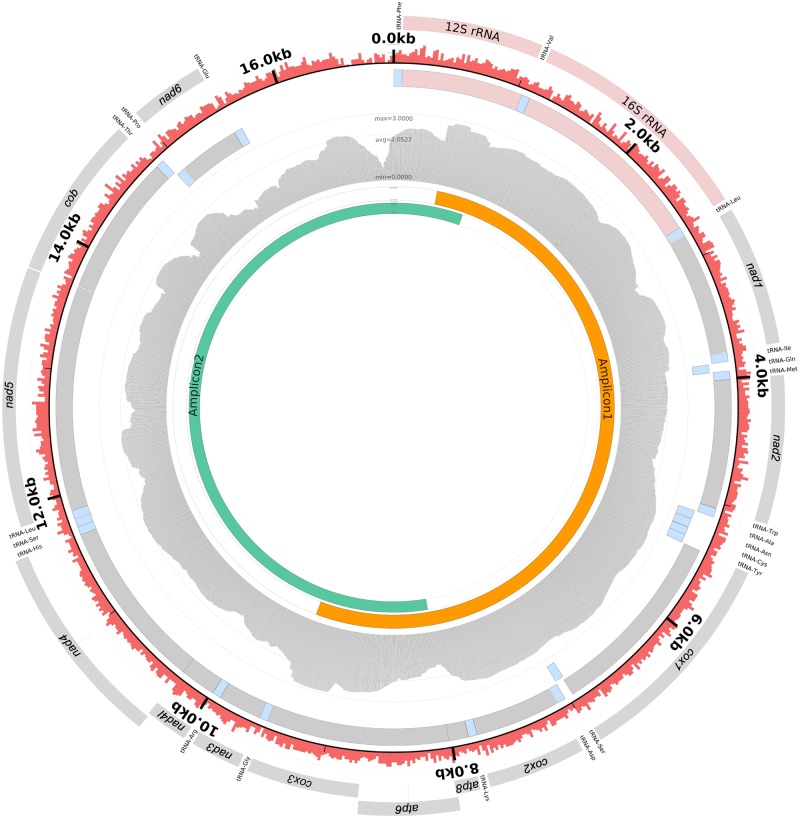
Fig 2. Graphical overview of the Corvus corax mitogenome.
The figure contains the following information, from the outermost to the innermost layer: (1) Gene products for annotated genes. (2) Genome position, minor ticks for every kb. Red bars illustrate GC-content in 20 bp windows. (3) Forward and (4) reverse genes. Blue colours show tRNAs, red colours show rRNAs and grey colours illustrate protein coding genes. (5) Coverage plot with log transformed coverage. (6) Position for amplicon 1 and (7) position for amplicon 2. The figure was created from GenBank accession KX245135 in the software Circleator [42].

