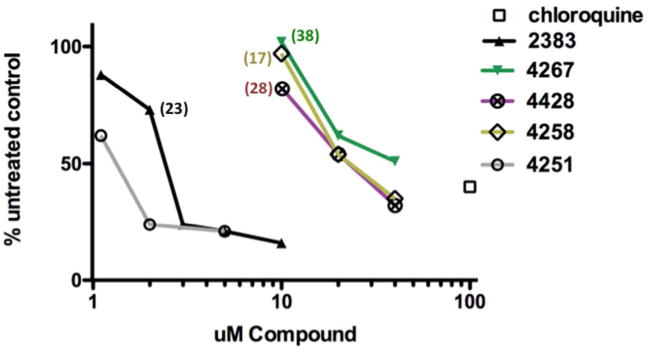
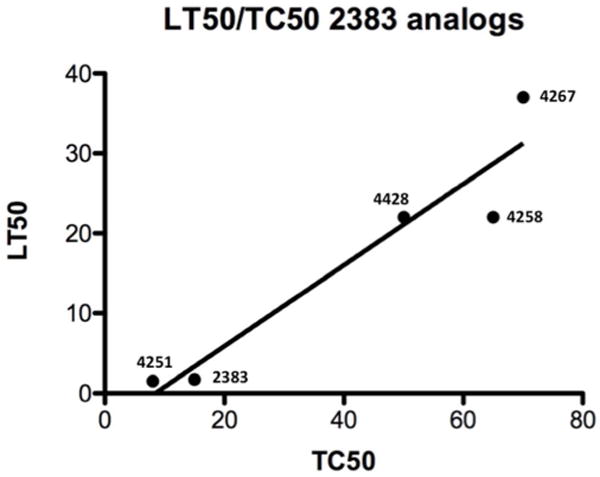
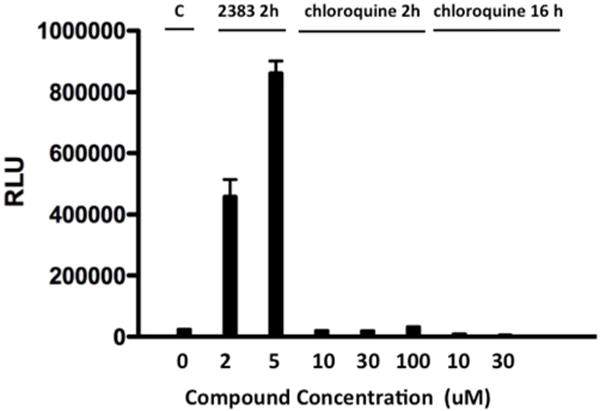
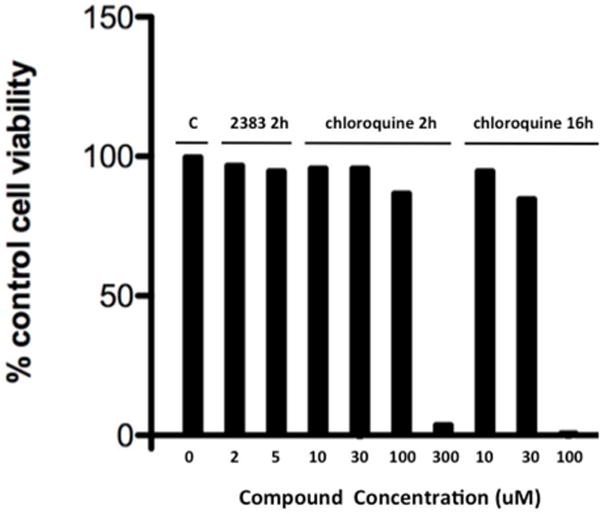
Figure 5. Effects on Lysosomes.


(a) Lysotracker Uptake. Accumulation of Lysotracker Red in HeLa Luc 705 cells was measured after a 2h exposure of cells to the indicated concentrations of various analogs. The lysosomotropic compound chloroquine was included as a positive control. Means of triplicate determinations are shown. The color-coded numbers refer to the fold increase in luciferase induction attained by the concentration of analog associated with the adjacent symbol on the graph. The numbers are taken from the data of Fig 1b for UNC2383 and Supporting Fig 2 for UNC4267, UNC4258 and UNC4428.
(b) LT50 vs TC50. The plot shows the ratio of the concentration of analog required for 50% inhibition of Lysotracker Red uptake (LT50) to the concentration required for 50% cell killing (TC50) under the same conditions of exposure. Nonlinear regression was calculated using Prism® software. The R2 value for the plot is 0.91.
(c) 2383 vs chloroquine; luciferase induction. HeLa Luc705 cells were exposed to SSO623 and then treated with various concentrations of UNC2383 or chloroquine for 2h and then tested for luciferase induction following the methods described in Figure 1. In a sub-set of the experiment cells were exposed to chloroquine for 16 h rather than 2h. Means +/− SE. N=3.
(d) UNC2383 vs chloroquine; cytotoxicity. After treatment as in 5c the cells were tested for viability using the Alamar Blue assay. Means, N=3.
