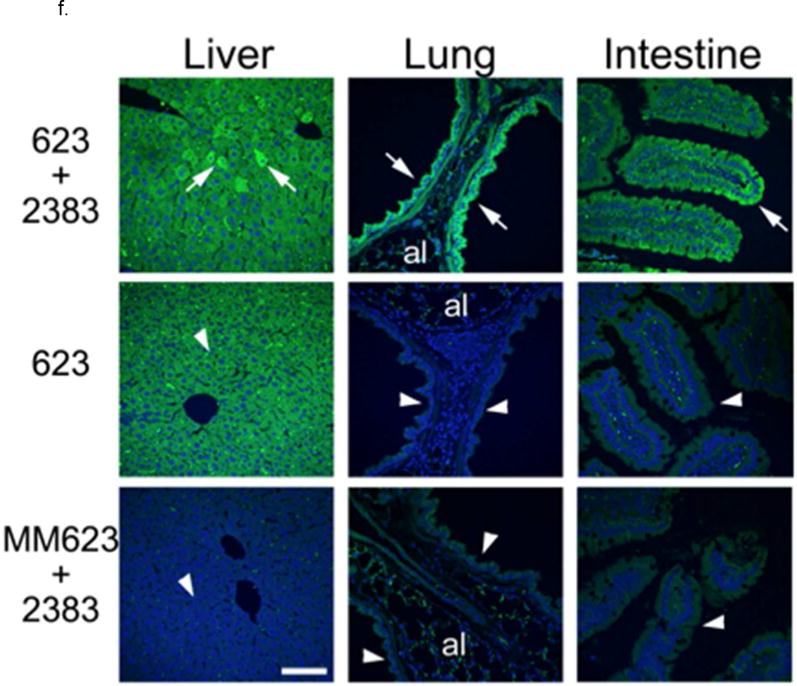
Figure 6.


In Vivo Effects-RNA. EGFP654 mice were treated with SSO623 or a mismatched control (MM) and then received UNC2383 or diluent (N=3). RT=PCR with gel analysis was used to detect correctly or incorrectly spliced EGFP mRNA. The gel images were quantitated using Fiji software. Gel image for liver (6a). The lower band (87bp) is correctly spliced EGFP mRNA while the upper band (160bp) is uncorrected. (b–e) Quantitation of splice correction in liver (b), kidney (c), intestine (d) and lung (e). The bars indicate the ratio of correctly spliced to incorrectly spliced mRNA ×100. The differences between the SSO623 only samples and the SSO623 plus UNC2383 samples are statistically significant.
f. In Vivo Effects-Protein. EGFP immunostaining was performed in liver, lung and intestine tissue and analyzed by confocal microscopy. Increased EGFP signal (green) was seen in groups of liver cells, epithelial cells lining the bronchi, and epithelial cells in the colonic crypts in mice treated with both SSO623 and UNC2383 (arrows) compared to matching tissues from control mice (arrowheads in control mouse tissues point to equivalent structures indicated by arrows in tissues from the SSO623 plus UNC2383 treated mice). Some non-specific fluorescence signal was observed in the alveoli (al) in the lung tissue sections of all mouse groups. Nuclei were counter stained with DAPI (blue). Bar =70 um.
