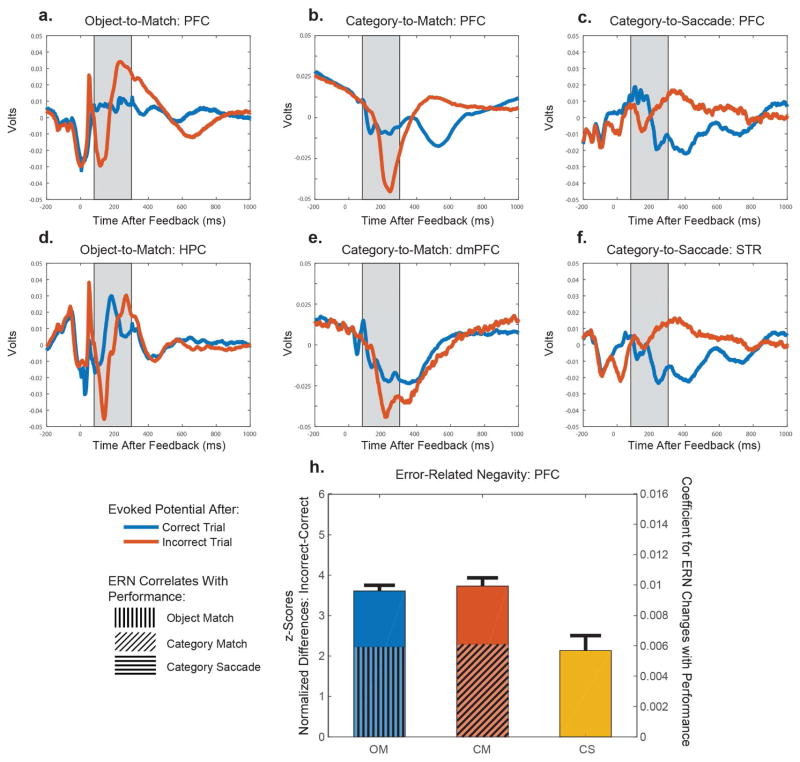
Figure 3.
A–C. Across all electrodes in prefrontal cortex, we computed the evoked potentials in each task separately. The blue line is the evoked potential averaged across correct trials, and the red line is the evoked averaged across the incorrect trials. The shaded grey region represents the time of an expected error-related negativity, between 80–300 ms after feedback. In the Object-Match and Category-Saccade tasks, we averaged across 242 and 64 electrodes distributed across vl- and dlPFC, respectively. In the Category-Match task, we averaged across each array within vl- and dlPFC (n = 97 arrays). D. Evoked potentials within the hippocampus (n= 162 electrodes), E. the supplementary eye fields (n = 30 arrays), and F. the striatum (n=65 electrodes) during the Object-Match, Category-Match, and Category-Saccade tasks respectively. G. The error-related negativity is plotted here for each task. The error-related negativity was computed by subtracting the evoked potentials on correct and incorrect trials, and aligned to the maximal differences across tasks. We compared the peak negativity by averaging around this peak (+/− 25 ms). The error bars represent +1 SEM. The hatched lines over lying the bars reflect the estimated coefficients for the change in the ERN as a function of performance (10 trial mean prior to feedback). In both Match tasks, the ERN increased with performance and hence behavioral certainty. The estimated coefficient in the Saccade task was near to 0, and not statistically significant. See also Figure S2.

