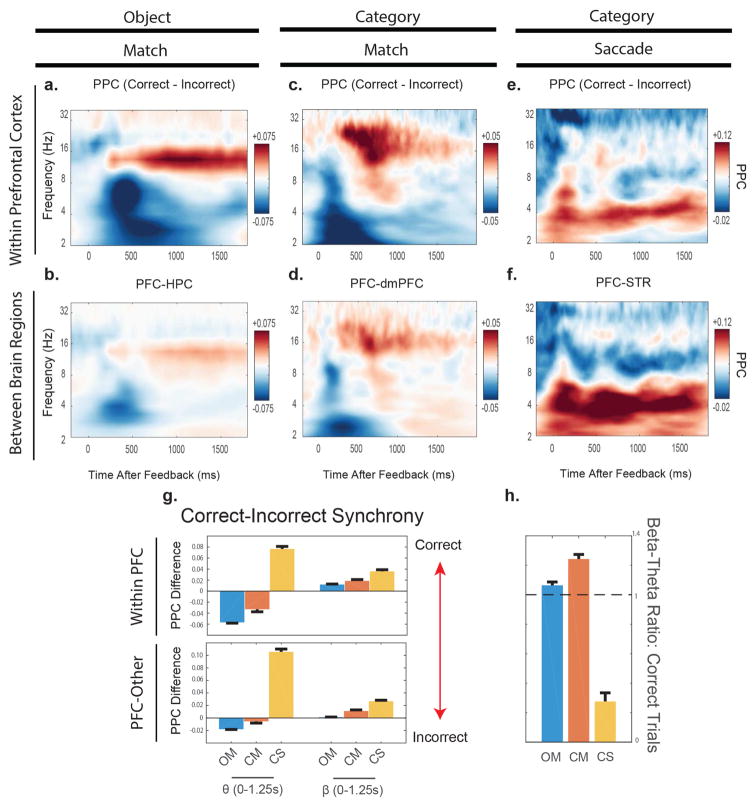
Figure 4.
In panels A–E., plotted is the difference in pairwise phase consistency between correct and incorrect trials. Red means a greater synchrony value on correct trials, and blue means a greater synchrony value on incorrect trials. Note the difference in color scales among the 3 panels. In G., we compared how the magnitude of these normalized synchrony values differed within the theta (3–7 Hz) and the alpha-2/beta bands (10–30 Hz) over time. In H, we computed that the ratio of beta-theta synchrony on correct trials varied for each task. We found that in both Match tasks the beta-theta ratio was greater than 1. This was not true in the Category-Saccade task (ratio = 0.2759). The error bars represent +1 SEM. See also Figure S3.

