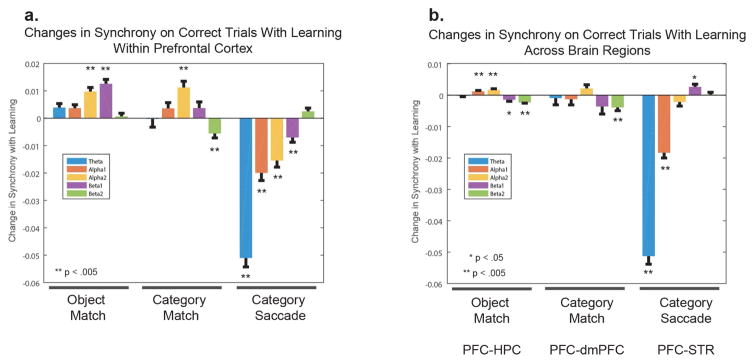
Figure 5.
We compared synchrony on correct trials early and late in learning. The bar plots represent a change from early to late learning, a positive value is associated with an increase in synchrony with learning and a negative value, a decrease. We computed synchrony at 5 different frequency bands: theta (3–7 Hz), alpha-1 (8–10 Hz), alpha-2 (10–12 Hz), beta-1 (13–17 Hz), and beta-2 (18 – 30 Hz). Error bars represent the SEM, and the stars represent significance. In A., we compared synchrony increases within PFC. In B. we compared synchrony changes with learning across different brain regions (OM: PFC-HPC, CM: PFC-dmPFC, CS: PFC-STR). See also Figure S4.

