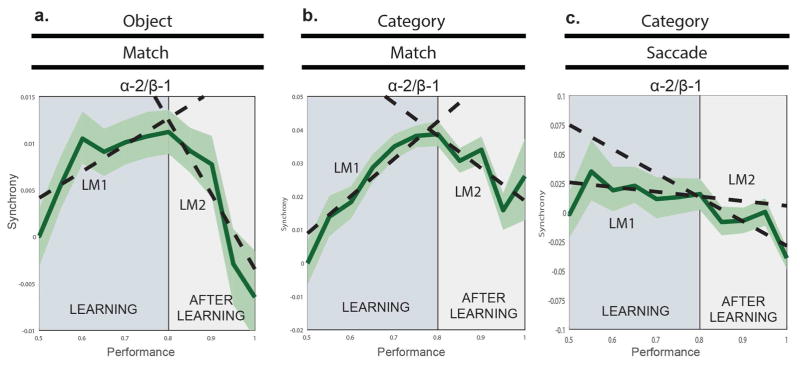
Figure 6.
Synchrony binned by non-overlapping, 20-trial window intervals. Error-bars represent the standard error of the mean. The dotted lines represent the fits of two different linear models, accounting for changes with learning. The mean synchrony at 50% performance level has been subtracted from each graph for visual purposes only. Linear Model 1 estimated the changes in synchrony with performance increases from 50% to 80%. Linear Model 2 estimated the changes in synchrony with performance increases from 80% to 100%. In A., all electrodes from within and between PFC and HPC in the OM task were used to obtain a single synchrony value for each performance bin. In B., we took all electrodes from within PFC and again obtained a single synchrony value for each 20-trial non-overlapping bin. C. We applied the same methods (as above) for all PFC electrodes within the Category-Saccade task. We repeated the same analysis with the PFC-STR electrodes (not shown), and still found no change before or after the criterion. The error bars represent ± SEM.

