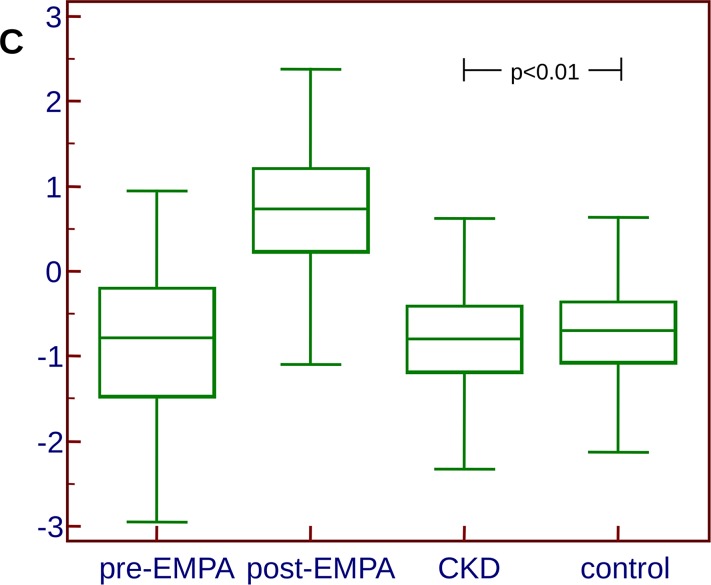
Fig 2. Box-Whisker blots of the scoring representing the proteome changes induced as a result of empagliflozin treatment.
The clear separation of the groups prior and after treatment is evident. However, when applying this classifier to a cohort of CKD patients and controls, the controls score slightly, yet significantly (p<0.01) higher (indicative of empagliflozin treatment) than the CKD patients.

