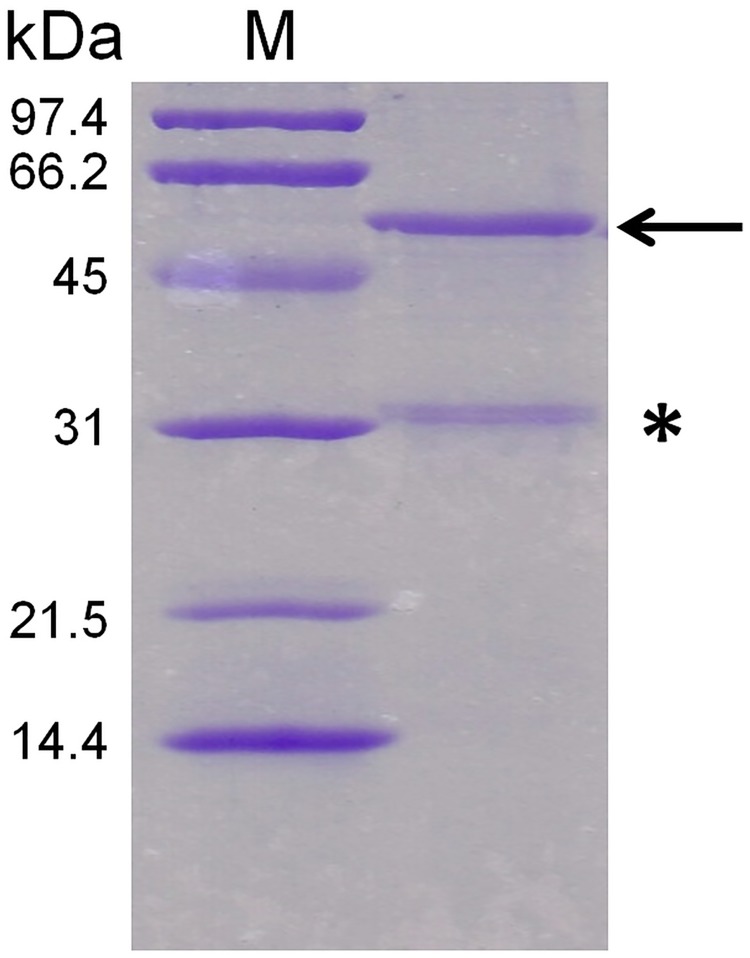
Fig 2. SDS-PAGE analysis of purified cT1R1-NTD inclusion bodies.
cT1R1-NTD is indicated with an arrow while the star indicates a band corresponding to a N-terminal fragment of cT1R1-NTD. The proteins were separated by 12% SDS-PAGE and stained with Coomassie blue. The molecular mass markers are in lane M.

