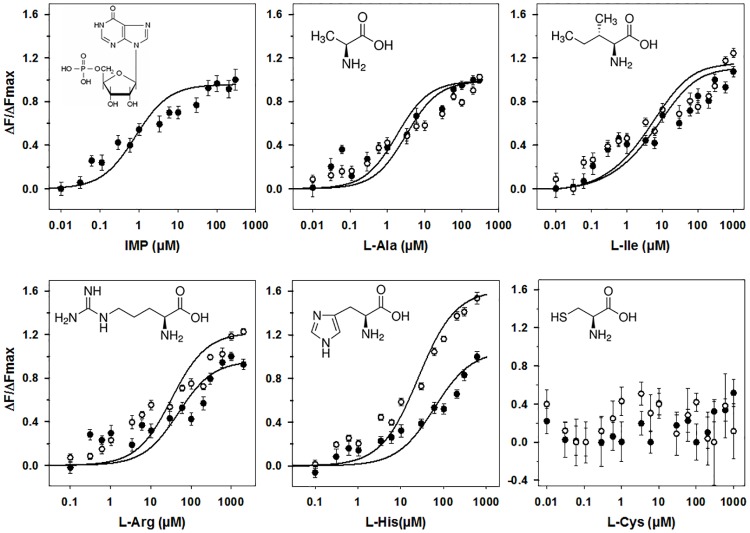
Fig 7. Binding properties of cT1R1-NTD assessed by intrinsic tryptophan fluorescence.
Titration curves of cT1R1-NTD with IMP alone and L-amino acids in the presence (open circles) or absence of 0.3 μM IMP (black circles). Circles show experimental data, while the solid lines are the computed binding curves; excitation and emission wavelength were 295 nm and 340 nm, respectively; cT1R1-NTD concentration 0.5 μM. Fluorescence of cT1R1-NTD alone was defined as 100% in absence of ligand. Data points correspond to mean ± SEMs of more than nine independent replicates of at least three independently refolded protein samples. Data fitted with sigmoid dose-response curves using SigmaPlot software.

