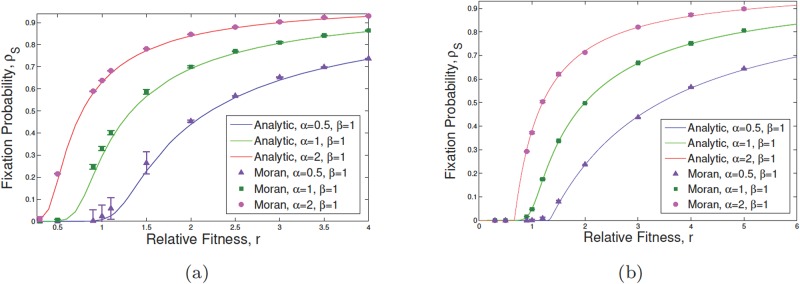
Fig 3. The fixation probability of mutants in the presence of phenotypic plasticity.
We suppose that NS = ND = 10, , r2 = αr, and in the exactly calculated results (solid curves) and stochastic simulation (points with bars as the standard error of the mean) starting with an initial mutant within SCs. Changing α from 0.5 to 1 and then to 2 while β remains fixed, the behavior of the system is shown in terms of the fixation probability with respect to the relative fitness r. In subfigure (a) plastic potential has only been considered for malignant individuals: η1 = 0, η2 = 0.5 while in (b) both WT and mutant cells can dedifferentiate to the stemness state (η1 = η2 = 0.5). Straightforward calculations reveal that for the given parameter values in (b), ρ = ρS = ρD.

