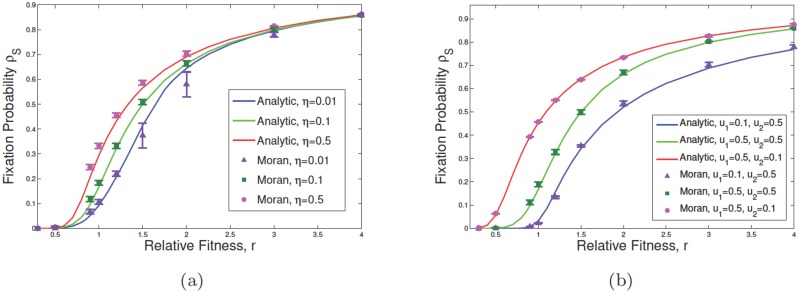
Fig 4. Effect of change in asymmetric differentiation and plasticity rates on survivability of mutants.
Subfigures show the variation of ρS with respect to the relative fitness of mutants r, in which we start with an initial mutant within SCs. We assume that NS = ND = 10, and . In subfigure (a), the fixation probability of SCs as a function of η is given, where η = 0.01, 0.1, 0.5 while u1 = u2 = 0.5, and η1 = 0. In (b) η1 = 0 and η = 0.1. Changing parameters u1 and u2, which are the asymmetric division rates of normal and tumor SCs respectively, the fixation probability as a function of u1, u2 is shown. Solid lines represent the exact calculation and points correspond to simulation results (error bars are based on the standard error of the mean).

