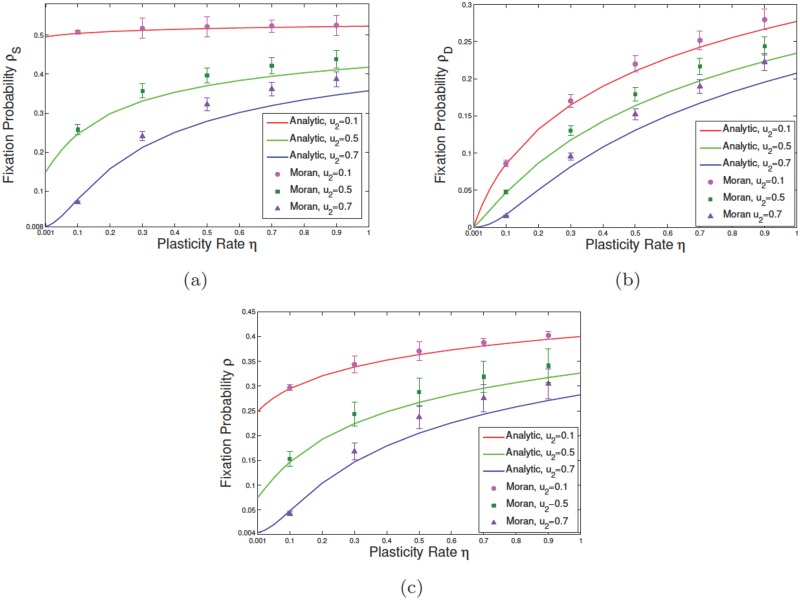
Fig 5. Effect of change in the rate of phenotypic plasticity for mutant DCs on the survival probability of malignant cells.
In subfigures (a), (b), and (c) we have respectively considered the fixation probability of mutants while the initial malignant mutation respectively occurs in SC, DC, and SC+DC compartments at random. In these plots, we assumed that NS = ND = 10, , and η1 = 0. Different asymmetric division rates of normal and malignant individuals have also taken into account when the fixation probability is given as a function of η. Solid curves and points are respectively the results of exact calculations and simulation analyses. At each given discrete point, the error bar depicts the standard error of the mean.

