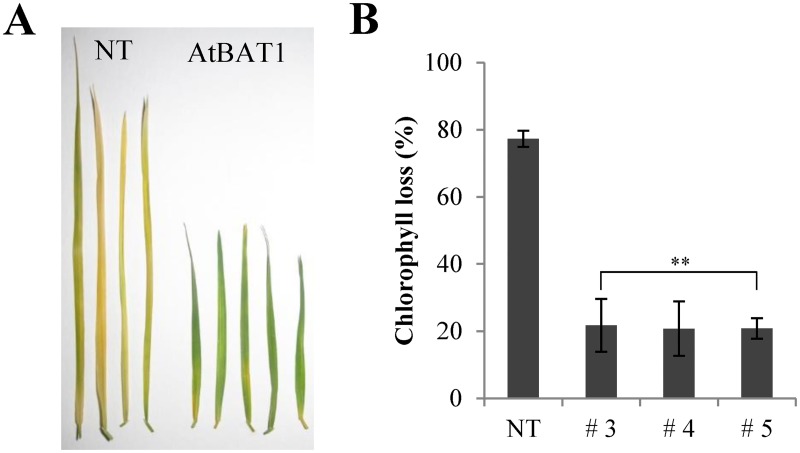
Fig 7. Comparison of leaf senescence between control plant (NT) and the AtBAT1 plants.
(A) Leaves after senescence treatment. The detached leaves were incubated for 2 weeks in the dark at 25°C. (B) Loss of chlorophyll content after the senescence treatment. Data represent means ± SD of three independent measurements. Statistically significant changes compared with NT are indicated by ** at P < 0.001.

