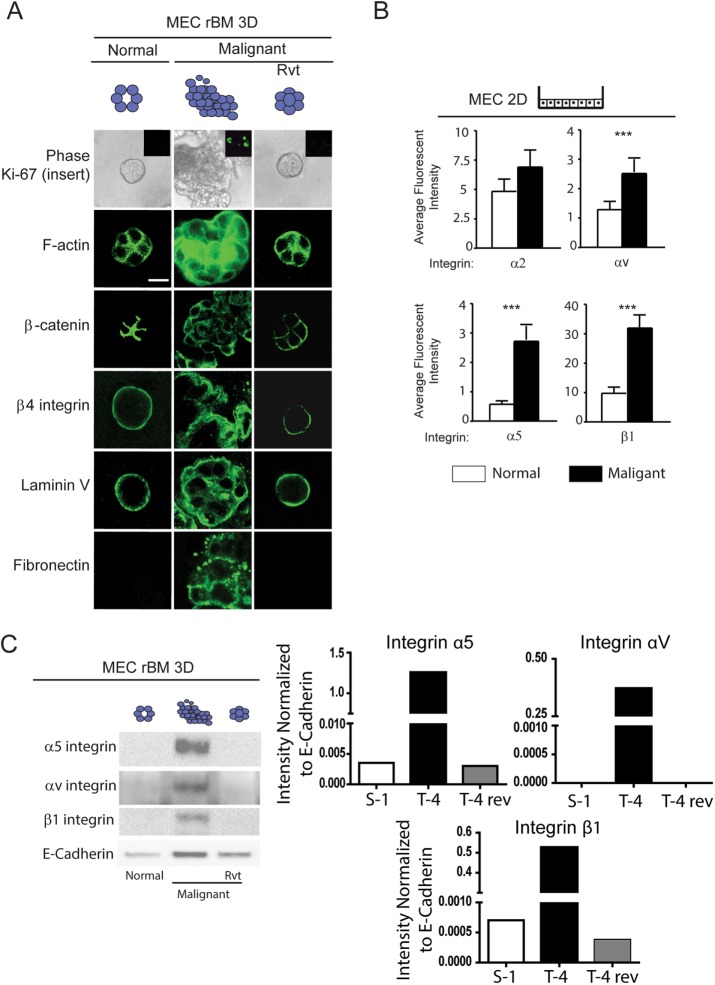
FIGURE 2:
Link between the malignant phenotype of mammary tumors and expression of FN and its integrin receptors. (A) Phase-contrast and confocal immunofluorescence images of Ki-67 (insert), phalloidin (F-actin), β-catenin, β4 integrin, laminin-5, and FN-stained colonies of nonmalignant (S-1), malignant (T4-2), and phenotypically reverted (T4 Rvt) HMT-3522 human MECs grown within an rBM for 2 wk. Scale bar: 10 μm. (B) Bar graphs of FACS analysis of membrane-localized integrins in S-1 compared with T4-2 MECs. (C) Representative immunoblot image of α5, αv, and β1 integrin in lysates from S-1, T4-2, and T4 Rvt 3D rBM colonies shown in A with corresponding quantification of signal intensity normalized to E-cadherin loading control. Fifty acini were analyzed in three separate experiments. ***, p < 0.001.

