FIGURE 3:
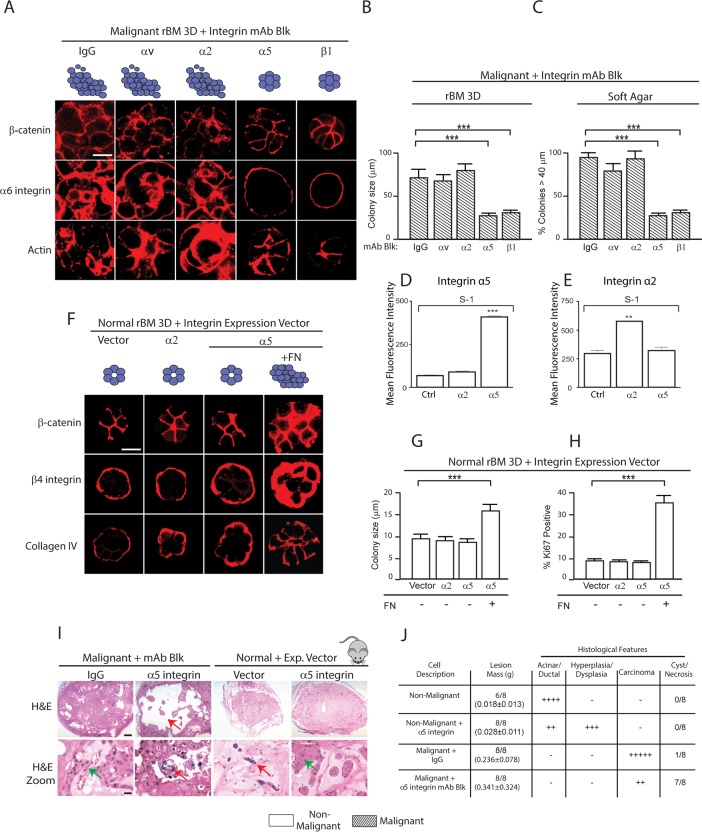
FN-ligated α5β1 integrin regulates the malignant phenotype of MECs in vitro and in vivo. (A) Confocal immunofluorescence images of β-catenin, α6 integrin, and actin (Phalloidin) staining of malignant (T4-2) MEC colonies grown for 2 wk in rBM in the presence of a function-blocking antibody (mAb) to αv, α2, α5, or β1 or an IgG isotype–matched control mAb. Scale bar: 30 μm. (B) Bar graph showing relative size of the T4-2 colonies shown in A. (C) Bar graph showing percentage of tumor colonies formed in soft agar (40+ microns) following treatment with function-blocking mAbs to αv, α2, α5, or β1 integrin or an IgG isotype–matched control mAbs. (D) Mean fluorescence intensity of integrin α2 and α5 expression in S-1 cells overexpressing Itga2. (E) Mean fluorescence intensity of integrin α2 and α5 expression in S-1 cells overexpressing Itga5. (F) Confocal immunofluorescence images of β-catenin, β4 integrin, and collagen IV staining of colonies of nonmalignant (S-1) vector (Ctrl) MECs and MECs expressing elevated α2 or α5 integrin grown in rBM with or without the addition of FN (+FN) for 2 wk. Scale bar: 10 μm. (G) Bar graph showing relative size of S-1 MEC colonies shown in D. (H) Bar graph showing percent Ki-67–positive S-1 MEC colonies shown in D. (I) Bright-field images of low (top) and high (bottom) magnification of H&E sections of tissue excised 2 mo following injection of malignant T4-2 MECs with IgG or a function-blocking antibody to α5 integrin and nonmalignant S-1 MECs expressing empty vector or an α5 integrin. Scale bar: 10 μm. Red arrows indicate areas of necrosis observed upon blocking of integrin a5. Red arrows indicate hyperplastic or dysplastic cellular structures. (J) Table summarizing tumor score and histological features. Scale bar: 10 μm. **, p < 0.01; ***, p < 0.001.

