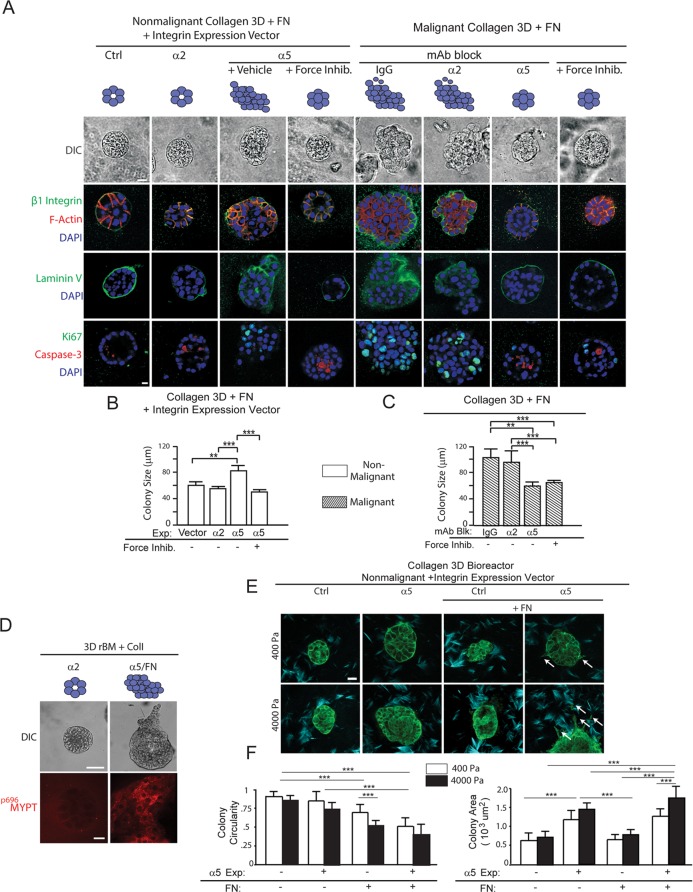
FIGURE 4:
FN-ligated α5β1 integrin increases cell tension to promote mammary malignancy. (A) Phase-contrast and confocal immunofluorescence images of β1 integrin, phalloidin (F-actin), laminin V, Ki-67 and activated caspase 3 (Caspase-3), and DAPI (nuclei)-stained colonies of nonmalignant (MCF10A) human MECs expressing empty vector or elevated α2 or α5 integrin treated with or without a ROCK inhibitor and malignant cells (HMT-3522 T4-2) incubated with nonspecific IgG or function-blocking antibodies to α2 or α5 integrin or treated with or without a ROCK inhibitor grown within a collagen gel with added FN for 2 wk. Scale bar: 8 μm. (B) Bar graph showing relative size of the nonmalignant colonies shown in A. (C) Bar graph showing relative size of the malignant colonies shown in A. (D) Immunofluorescence confocal images (bottom) and phase-contrast images (top) of 3D cultures of α2/Col 1 and α5/FN nonmalignant MECs stained for the ROCK target p696MYPT (top). Scale bar: 50 μm. (E) Second harmonic generation images of nonmalignant (MCF10A) human mammary epithelial day 20 acini (green) expressing empty vector or elevated α5 integrin with or without FN embedded in collagen (blue) and installed into a 3D tension bioreactor system and subjected either to 0% (400 Pa) or 10% (4000 Pa) stretch, as described previously (Cassereau et al., 2015). Arrows in E indicate invasive cells and colony circularity (left) and area (right) are quantified in F. Results are the mean ± SEM of three to five separate experiments. **, p < 0.01; ***, p < 0.001. (Ten to 15 acini were analyzed per condition in three separate experiments.)

