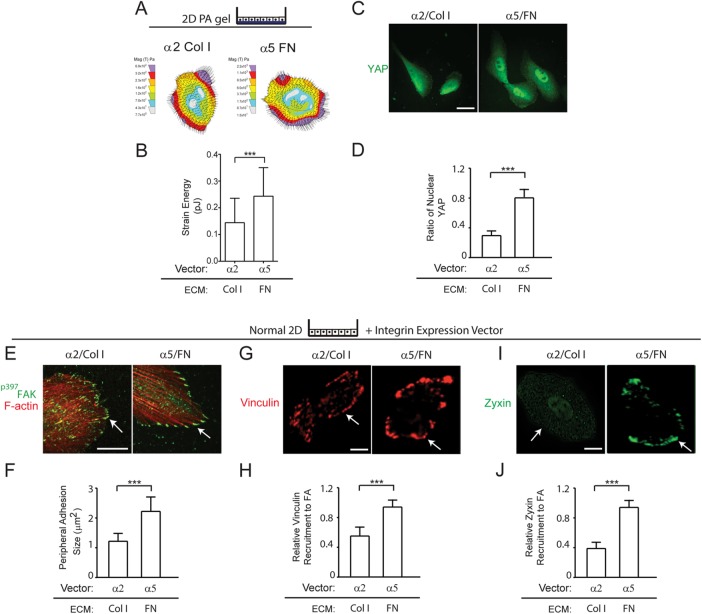
FIGURE 5:
FN-ligated α5β1 integrin and not collagen-ligated α2β1 increases MEC cell tension. (A) Force maps of α2/Col 1 and α5/FN nonmalignant MECs and bar graphs (B) showing maximum traction generated by MECs at the cell edge. (C) Immunofluorescence images of α2/Col 1 and α5/FN nonmalignant MECs stained for YAP (arrow indicating nuclear localization of YAP). Scale bar: 15 μm. (D) Bar graphs quantifying percent nuclear YAP in MECs shown in H. Results are the mean ± SEM of three separate experiments with 10–15 acini analyzed per condition. (E) Immunofluorescence confocal images of nonmalignant MECs expressing either exogenous α2 integrin plated on type I collagen (α2/Col 1) or exogenous α5 integrin plated on FN (α5/FN) stained for p397FAK (green) or with phalloidin (F-actin; red). Scale bar: 10 μm. (F) Bar graph quantifying size of peripheral adhesions shown in E. (G) Immunofluorescence confocal images of α2/Col 1 and α5/FN nonmalignant MECs stained for vinculin (red). Scale bar: 3 μm. (H) Bar graphs showing quantification of relative amount of vinculin recruited to focal adhesions in MECs shown in G. Quantification is relative to α5-overexpressing cells on FN-coated matrices. (I) Immunofluorescence confocal images of α2/Col 1 and α5/FN nonmalignant MECs stained for zyxin (green). Scale bar: 3 μm. (J) Bar graphs showing quantification of relative zyxin recruited to focal adhesions in MECs shown in I. Quantification is relative to α5-overexpressing cells on FN-coated matrices. Arrows in C, E, G and I indicate peripheral localization of adhesion molecules. Results are the mean ± SEM of three separate experiments with 10–15 cells analyzed per each condition for each experiment. ***, p < 0.001. Scale bars: 50 μm.

